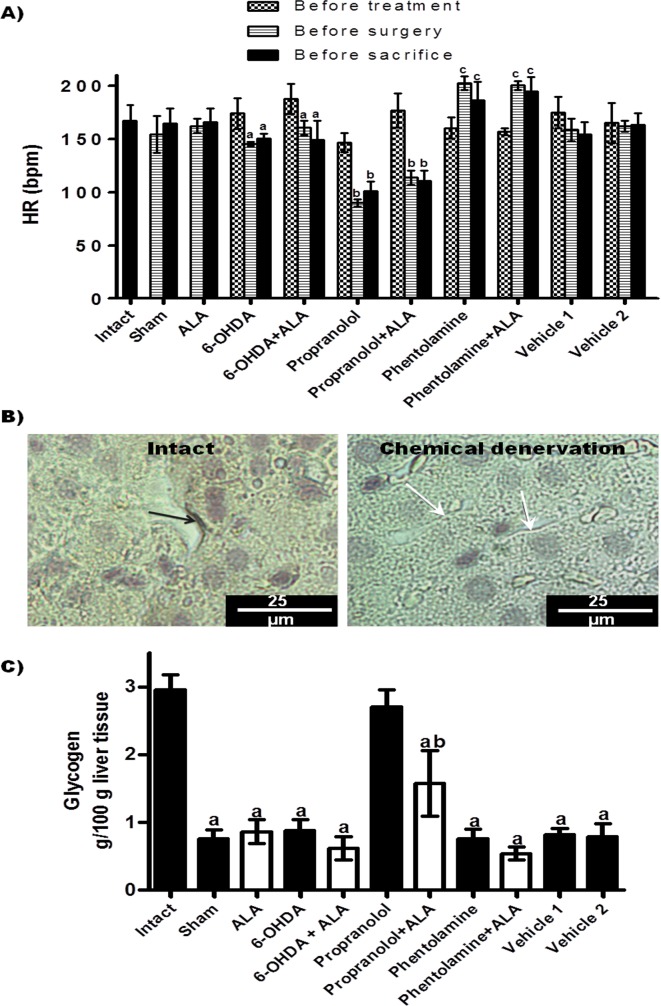
Figure 1.
Evaluation of the autonomic nervous system. (A) Heart rate (HR) of experimental groups; each bar represents the mean value of beats per minute (bpm) ± SE (n<5); corresponding to each group, the mean values were significantly different with respect to HR measurement before starting the 6-OHDA (a), propranolol (b) and phentolamine (c) treatments, p<0.05. (B) Immunohistochemistry analysis of hepatic tyrosine hydroxylase (TH) synthesis: representative images of livers from animals with chemical denervation (6-OHDA and 6-OHDA+ALA groups) and healthy animals (sham and intact groups); TH(+) fiber (black arrow) and TH(-) fiber (white arrow). (C) Glycogen content in liver was determined from healthy groups (black bars) and infected with trophozoites (white bars); each bar represents the mean value of experiments performed in duplicate assays ± SE (n<5). a, Mean values significantly different from the intact group, p<0.05; b, mean values significantly different from the propranolol group, p<0.05.

