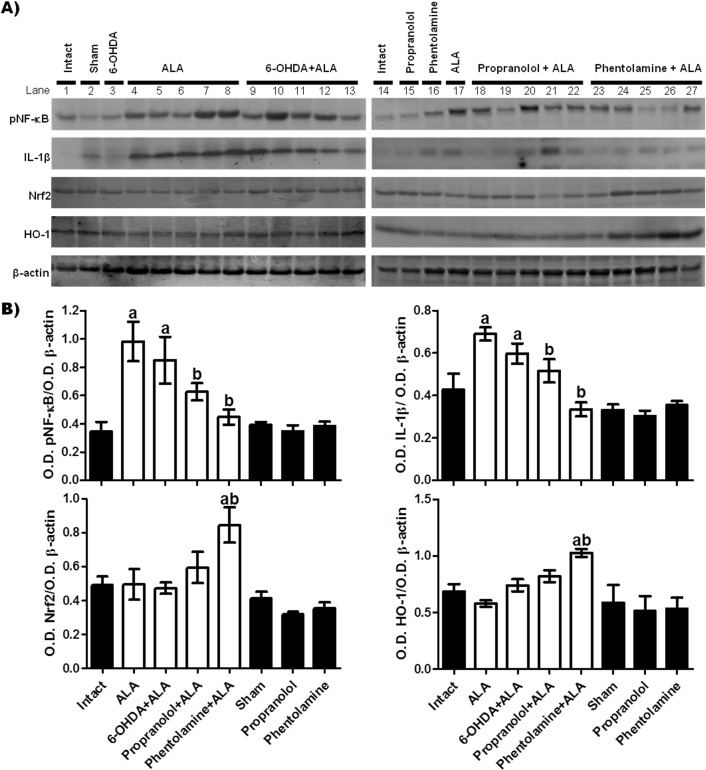
Figure 6.
Effect of α and β-AR blockers on the protein expression of pNF-κB, IL-1β, Nrf2 and HO-1 in liver samples taken from amebic abscess areas. (A) Representative images of western blot; each line corresponds to a sample from a different animal, line 1: samples from one animal (intact group), line 2: one animal (sham group), line 3: one sample (6-OHDA group), lines 4 to 8: samples of five animals (ALA group), lines 9 to 13: samples of five hamsters (6-OHDA+ALA group), line 14: one sample (intact group), line 15: one sample (propranolol group), line 16: one sample (phentolamine group), line 17: one sample (ALA group), lines 18 to 22: samples of five animals (propranolol+ALA), lines 23 to 27: samples of five hamsters (phentolamine+ALA). (B) Signal intensities were determined by densitometric analysis of treated blots and values calculated as the ratio of each protein/β-actin. The results shown represent the mean value obtained ± SE of three independent experiments of proteins samples from the 5 hamsters. Corresponding to each protein: a, mean values significantly different from the intact group; and b, mean values significantly different from the ALA group; (p<0.05).

