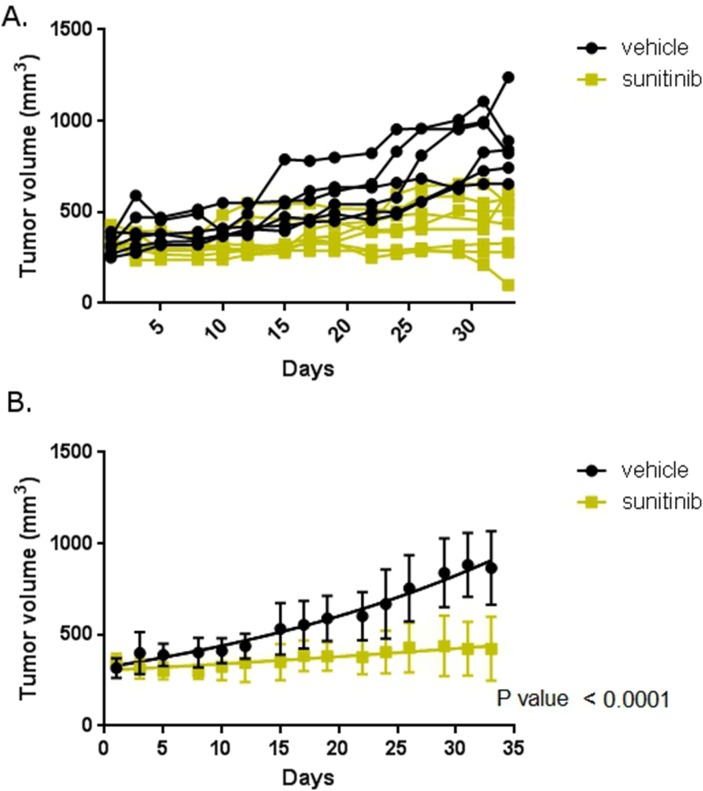
Figure 8. Mouse model reflects clinical experience.
Mice with xenograft RCC tumors were treated with sunitinib or vehicle. (A) Tumor size in individual mice. Mice were treated with vehicle or sunitinib as labelled and tumor size measured with calipers. (B) Mean tumor size in each treatment cohort. Error bars are standard deviation. The trend lines are shown within each group. P-value is for difference in slope over the course of the therapy.

