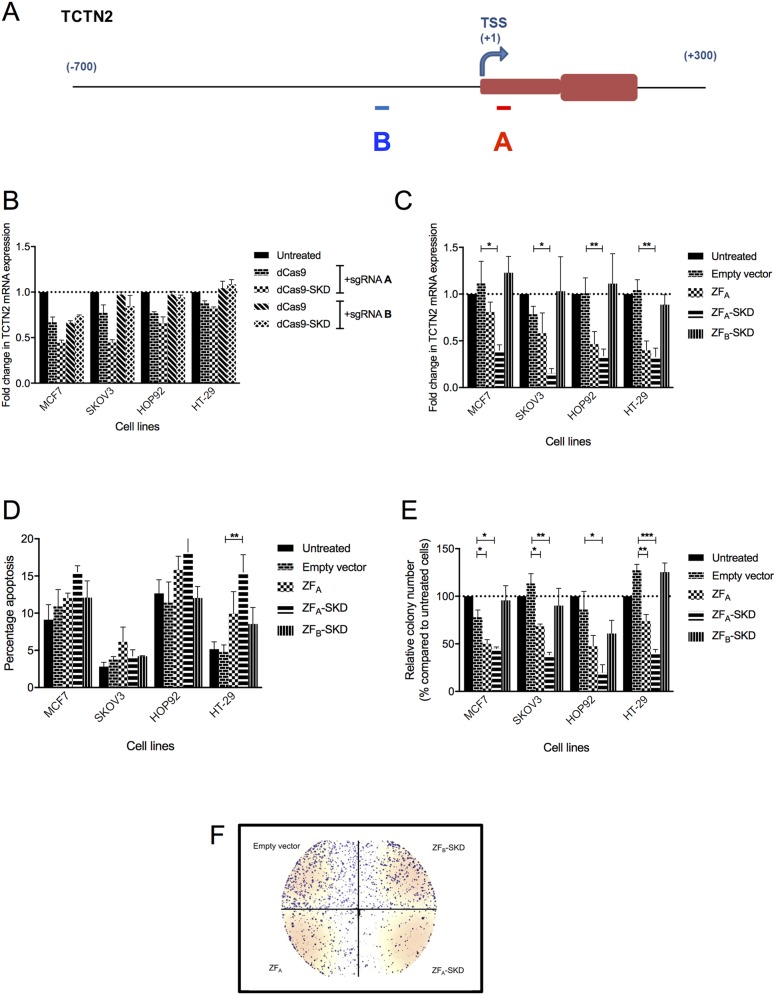
Figure 3. TCTN2 downregulation, by different platforms, alters growth phenotypes in four cell lines.
(A) Representation of TCTN2 gene promoter and first exon, transcription start site (TSS); A and B mark the region targeted. (B) TCTN2 mRNA downregulation using CRISPR-dCas9 sgRNA A and B regions alone. (C) TCTN2 mRNA downregulation using ZF A and B regions fused to a transcriptional repressor (SKD). (D) Apoptosis was measured using the 1, 1′,3,3,3′,3′-Hexamethylindodicarbocyanine iodide (DilC) assay in cells treated with different ZFs after TCTN2 downregulation. (E) Colony-forming assay in cells after TCTN2 downregulation. (F) Visual representation of the colony-forming assay from HT-29 cells. Data represent the mean value of two independent experiments, run in triplicate, and are shown as mean ± s.e.m. Statistical significance was assessed by non paired two-tailed Student's t-test (*P<0.05, **P<0.01, ***P<0.001).

