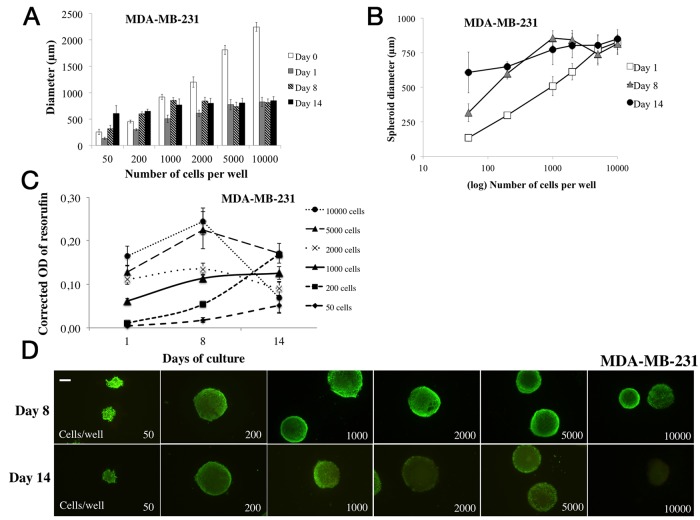
Figure 3. Parameter determination for MDA-MB-231 cell line spheroid formation.
For MDA-MB-231 cell line spheroid formation, 50 to 10000 cells were seeded in 96-wells microplates (“ULA” for Ultra Low Attachment, Corning®) at Day 0 and 2% Geltrex® was added to the wells at Day 1. All experiments were carried out at Day 1, Day 8 and Day 14. (A) Cell concentration determination for spheroid formation: the diameter of each spheroid was measured by light microscopy with ToupView® software. Day 0 measures correspond to aggregate diameters. (B) Spheroid diameter evolution over time: spheroid diameter (μm) was measured with ToupView software® for all tested cell concentrations (log10 scale). (C) Cell metabolic activity in spheroids via resazurin test: the resazurin is reduced into resorufin by metabolically active cells. Corrected OD of resorufin (λ570- λ620 nm) was measured after 15h incubation with 60 μM resazurin in PBS. (D) Cell viability/mortality in spheroids with Live/Dead® imaging: Green marking corresponds to calcein-AM penetration (viable cells). Red markings correspond to ethidium homodimer-1 cell penetration (dead cells). Scale bar = 200 μm. Graphs represent at least triplicate biological repeats and are displayed as mean ± SEM and *p<0.05, **p<0.01, ***p<0.001, ****p<0.0001 and *****p<0.00001.

