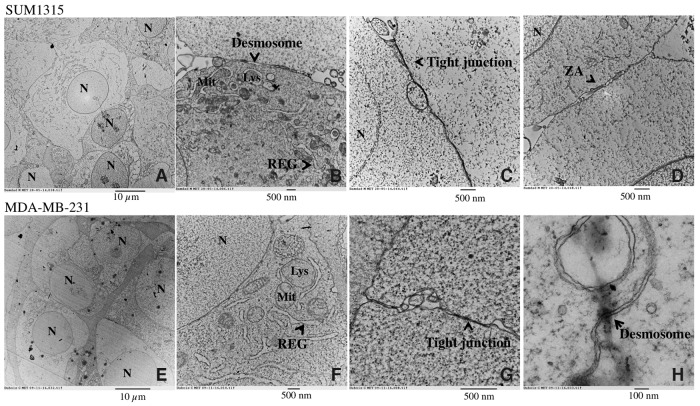
Figure 5. Ultrastructure of SUM1315 and MDA-MB-231 spheroids by Transmission Electron Microscopy (TEM).
Cells were seeded at 1000 cells per well with 2% Geltrex®, added at Day 1. Images were taken after 5 days of culture with transmission electron microscope Hitachi H-7650. Scale bars are shown on all images. M=magnification SUM1315 cells ultrastructure in 3D cell culture conditions: (A) M=3000X, (B) M=15000X, (C) M=25000X, (D) M=25000X. MDA-MB-231 cells ultrastructure in 3D cell culture conditions: (E) M=3000X, (F) M=20000X, (G) M=60000X, (H) M=120000X. N=nucleus, Mit=mitochondria, Lys=lysosome, REG= Rough Endoplasmic Reticulum, ZA=zonula adherens. Scale bars are shown on all images.

