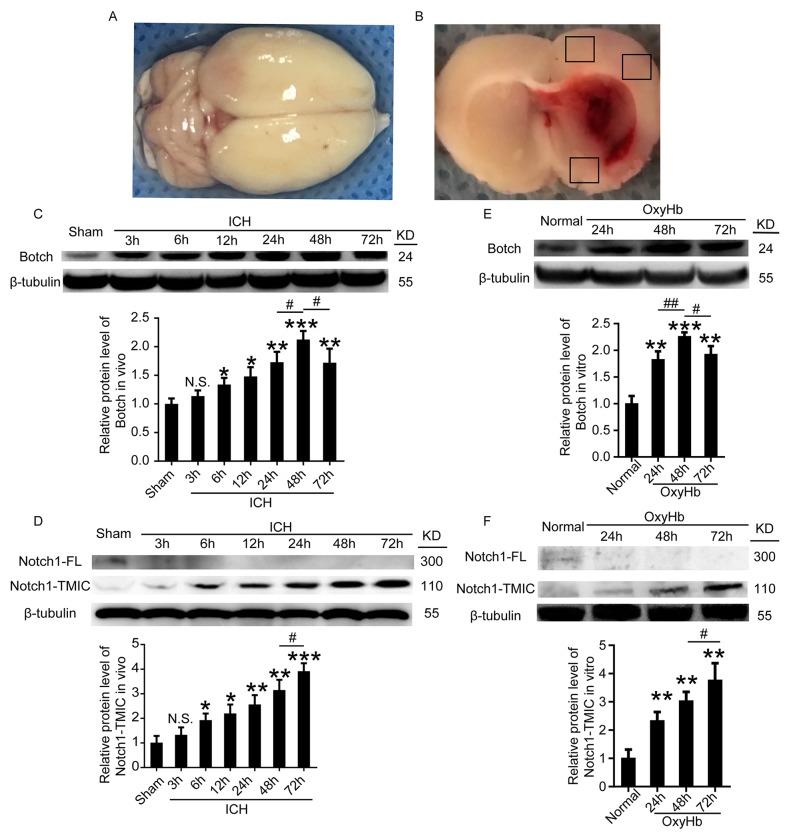
Figure 1. The protein levels of Botch and Notch1-TMIC in brain tissue around hematoma and cultured neurons following ICH and OxyHb treatment.
(A) Representative whole brains and autologous arterial blood injection ICH model. (B) Schematic representation of the suitable region taken for assay. (C, D) Western blot analysis and quantification of the protein levels of Botch and Notch1 in brain tissue around hematoma. (E, F) Western blots analysis and quantification of the protein levels of Botch and Notch1 in cultured neurons. In (C-F), mean values for sham or normal group were normalized to 1.0. (C) N.S. indicates no significant difference, p = 0.1609, 3 h vs sham; *p = 0.0174, 6 h vs sham; *p = 0.0113, 12 h vs sham; **p = 0.0036, 24 h vs sham; ***p < 0.001, 48 h vs sham; **p = 0.0088, 72 h vs sham; #p = 0.0157, 48 h vs 24 h; #p = 0.0142, 48 h vs 72 h. (D) N.S. indicates no significant difference, p = 0.2497, 3h vs sham; *p = 0.0141, 6 h vs sham; *p = 0.0106, 12 h vs sham; **p = 0.0046, 24 h vs sham; **p = 0.0018, 48 h vs sham; ***p < 0.001, 72 h vs sham; #p = 0.0141,72 h vs 48 h. (E) **p = 0.0019, 24h vs normal; ***p < 0.001, 48 h vs normal; **p = 0.0013, 72 h vs normal; ##p = 0.0065, 48 h vs 24 h; #p = 0.0248, 48 h vs 72 h. (F) **p = 0.0047, 24 h vs normal; **p = 0.0011, 48 h vs normal; **p = 0.0018, 72 h vs normal; #p = 0.0484, 72 h vs 48 h.

