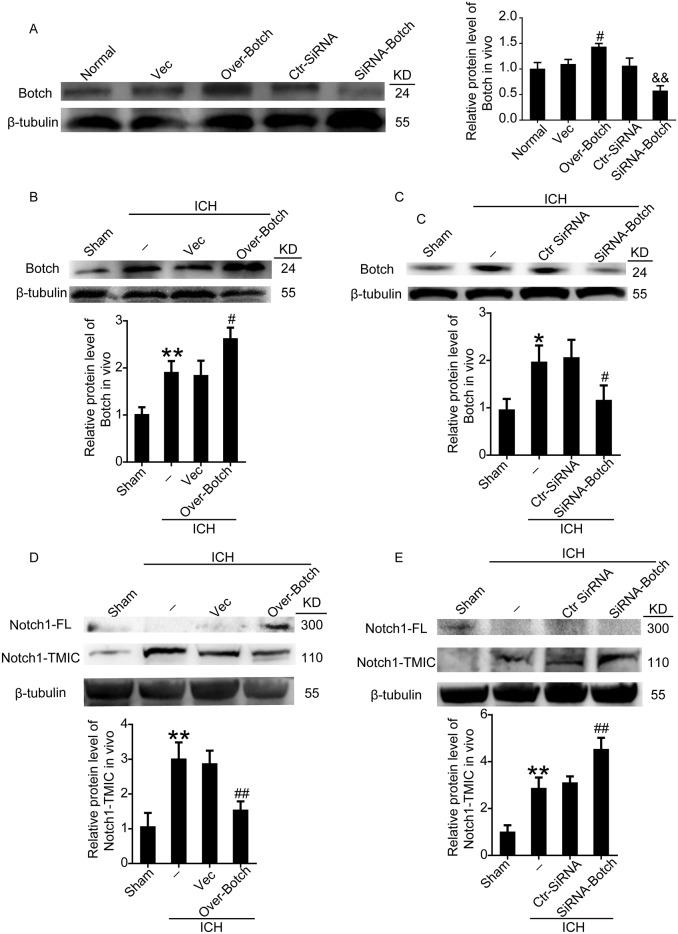
Figure 4. Effects of overexpression and knockdown of Botch on the protein levels of Botch and the maturation of Notch1 in brain tissue around hematoma.
(A) Transfection efficiency of Botch expression plasmid and siRNA in rat brains. (B, C) Transfection efficiency of Botch expression plasmid and siRNA in brains of ICH rats. (D, E) Effects of overexpression and knockdown of Botch on the protein levels of Notch1 in brain tissue under ICH insults. In (A-E), mean values for sham group were normalized to 1.0. (A) #p = 0.0202 vs vector, && p = 0.0017 vs ctr-siRNA. (B) **p = 0.0039 vs sham, #p = 0.0128 vs ICH + vector. (C) *p = 0.0168 vs sham; #p = 0.0305 vs ICH + ctr-siRNA. (D) **p = 0.0050 vs sham; ##p = 0.0023 vs ICH + vector. (E) **p = 0.0033 vs sham; ##p = 0.0032 vs ICH + ctr-siRNA.

