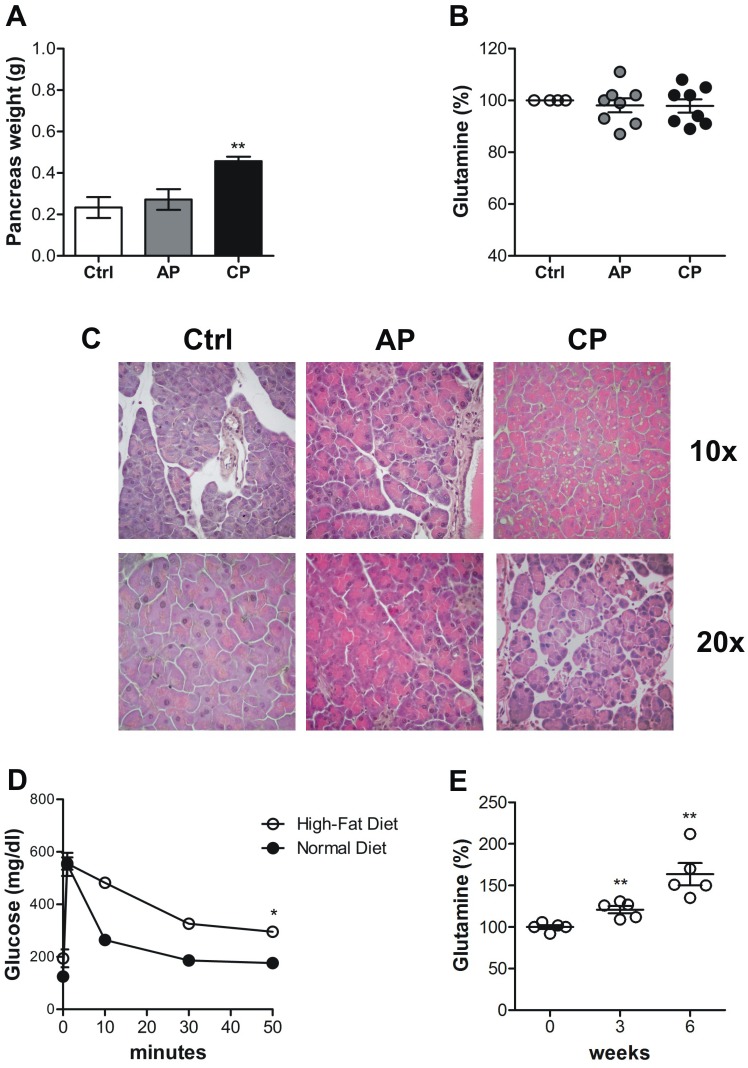
Figure 7. The decrease in circulating glutamine does not correlates with inflammation.
(A-C) Acute (AC) and Chronic Pancreatitis (CP) were induced in C57BL/6 mice through several injections of caerulein. A. Pancreases were collected and weighed from PBS-treated control and AC- and CP-affected mice. B. Graph represents percentage of blood glutamine compared to control group after induction of pancreatitis (5-8 mice/time point). Mean±SEM are indicated. E. H&E staining of pancreas sections of control mice, and acute and chronic pancreatitis-affected mice. (D) Plasma glucose concentrations during the intravenous glucose tolerance test (1 g/kg) in mice fed with Normal Diet or with High-Fat Diet for six weeks. Blood was sampled at 0, 1, 10, 30 and 50 minutes and glucose concentration is expressed as mg/dl. (E) Graph represents percentage of blood glutamine of mice before HFD feeding (time 0) versus 3 and 6 weeks of HFD feeding (5 mice/time point). Mean±SEM are indicated. * P <.05; ** P <.01; *** P <.001 values showing a significant difference of AP and CP compared to the control group for the pancreatitis model and HFD-fed mice compared to time 0.

