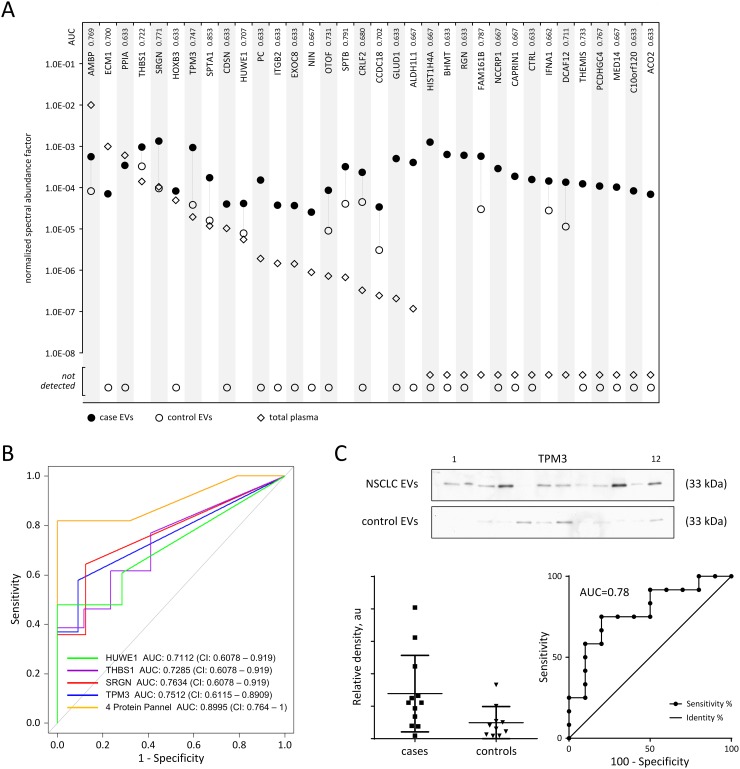
Figure 4. Enrichment of tumor proteins in plasma-derived EVs and classifier performance.
(A) Differential enrichment of EV proteins was evaluated for proteins with ≥ 3-fold case:control expression and p < 0.05. The average normalized spectral abundance factor (NSAF) for each protein was calculated from respective LC-MS/MS proteomic analyses of adenocarcinoma case plasma-derived EVs (●) black circle; disease free control plasma-derived EVs (○) open circle; and unfractionated plasma from paired cancer, lung disease and control specimens (◊) diamond. (B) Receiver operating characteristic curve analyses of top performing plasma EV protein markers SRGN (red), TPM3 (blue), THBS1 (violet), and HUWE1 (green). The four marker combination (yellow) yielded an AUC of 0.8995. (C) Immunoblot analysis of plasma-derived extracellular vesicles from adenocarcinoma cases and matched controls to demonstrate marker performance in immunoassay. Marker abundance as quantified by densitometry of western blot, lower left; ROC curve analysis of TPM3 performance based on western blot data, lower right.

