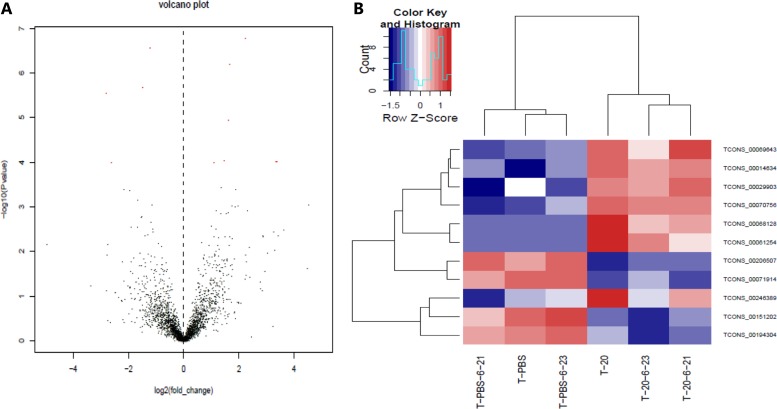
Figure 6. New lncRNAs expression profile differences between HQ group compared to PBS group.
(A) Volcano plots of the differentially expressed new lncRNAs. The dark dots represent new lncRNAs not significantly differentially expressed (fold change < 2, P > 0.05) and red dots represent new lncRNAs significantly differentially expressed (fold change ≥ 2, P < 0.05). Left and right indicate up and down regulation. (B) Hierarchical clustering indicates new lncRNAs. Red through blue color indicates high to low expression level.

