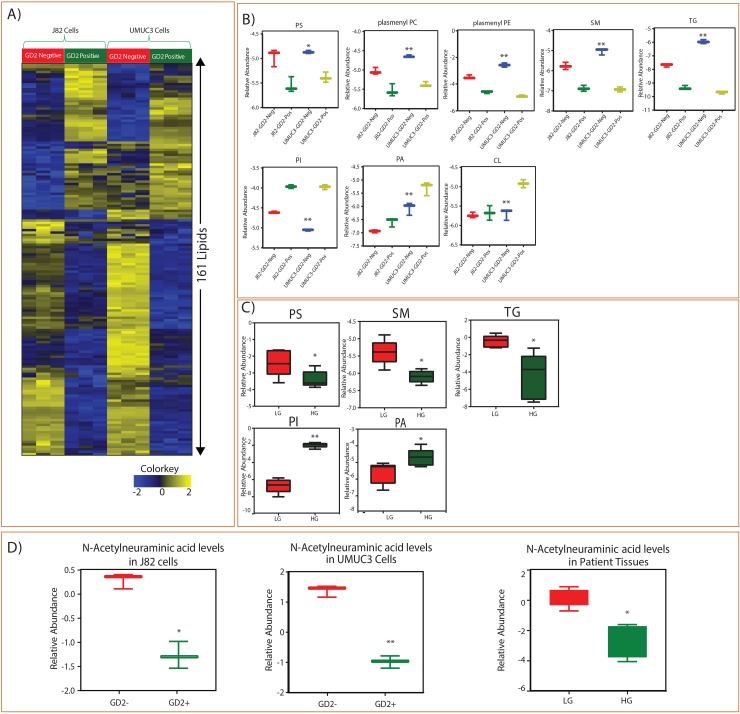
Figure 3. Identified lipid class alterations in GD2 +/- BLCA cell lines (J82 and UMUC3) and BLCA tissues.
(A) Heat map of GD2+/- sorted cells altered lipids from J82 and UMUC3 cell lines. Columns represent individual samples, and rows represent distinct lipids. Shades of yellow and blue represents higher and lower levels of lipids, relative to the median metabolite levels respectively (FDR<0.25). (B) Box plots are showing altered lipid classes in BLCA GD2+/- J82 and UMUC3 cell lines. (C) Box plots showing altered lipid classes in BLCA patients (LG= low grade, HG= high grade. (D) Box plots showing N-Acetylneumeric acid levels in cell lines and BLCA tissues (* indicates p<0.05; ** indicates p<0.001).

