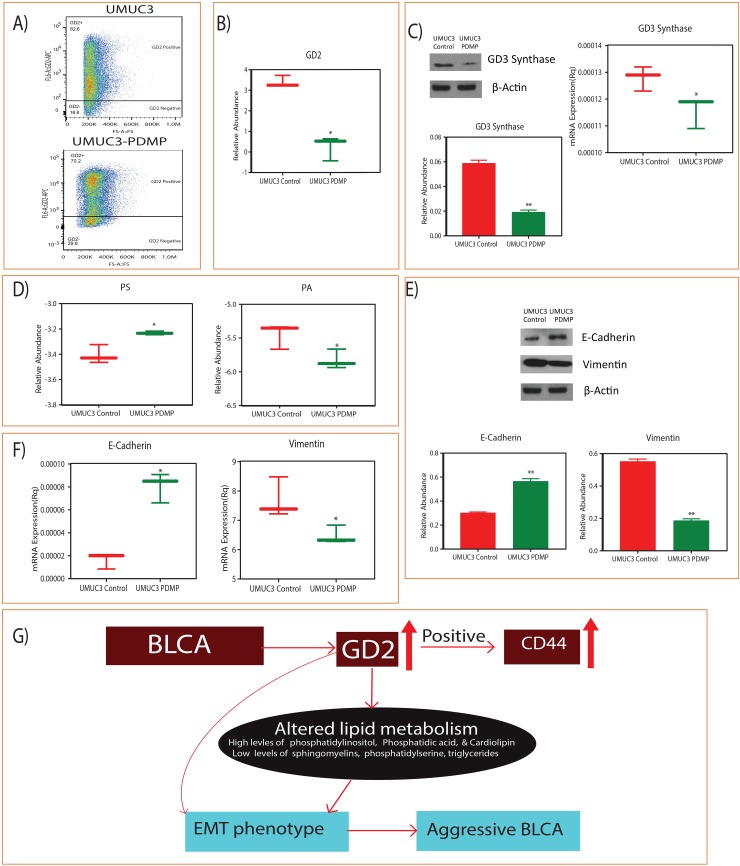
Figure 5. Inhibition of GD2 synthesis and switching of lipid classes and EMT phenotype.
(A) Flow cytometry analysis shows the reduction of GD2 upon 5 μM D-PDMP for 72hours. (B) Reduced GD2 levels measured by LC-MS. (C) Immunoblot and qPCR shows the reduced levels of GD3 synthase and their quantification. (D) Switching of PS and PA lipid classes. (E and F) Immunoblot and qPCR analysis of E cadherin and vimentin levels upon GD2 inhibition for 72 hours. (G) Working model of GD2 in high grade BLCA development (* indicates p<0.05; ** indicates p<0.001).

