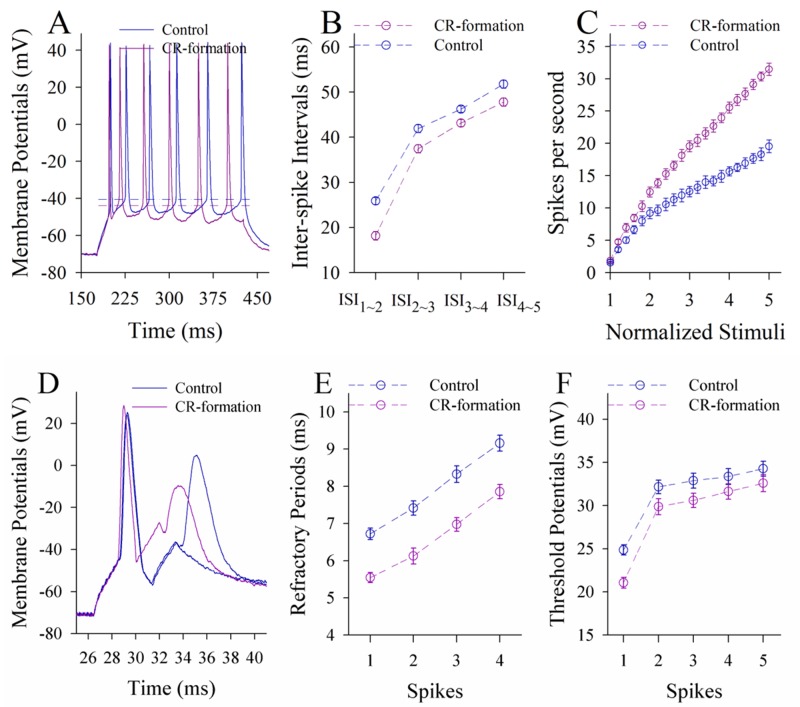
Figure 6. The ability to encode spikes on the pyramidal neurons of the piriform cortices increases in CR-formation mice.
The spikes were evoked by depolarization pulses under the current-clamp recording in glutamatergic neurons of the cortical slices. (A) Traces show depolarization-induced spikes on the neurons from control (blue trace) and CR-formation (red). (B) illustrates inter-spike intervals for spikes 1~2 up to spike 4~5 from controls (blue symbols, n=19 neurons from nine mice) and CR-formation (red, n=19 neurons from nine mice). (C) shows spikes per second vs. normalized stimuli (input-output) from controls (blue symbols, n=19) and CR-formation (reds, n=19 neurons from nine mice). (D) Traces illustrate the measurements of spike refractory periods on the neurons from control (blue trace) and CR-formation (red). (E) illustrates refractory periods versus spikes 1 to 4 from controls (blue symbols, n=19 neurons from nine mice) and CR-formation (reds, n=19 neurons from nine mice). (F) illustrates threshold potentials versus spikes 1 up to 5 from controls (blue symbols, n=19 neurons from nine mice) and CR-formation (reds, n=19 neurons from nine mice).

