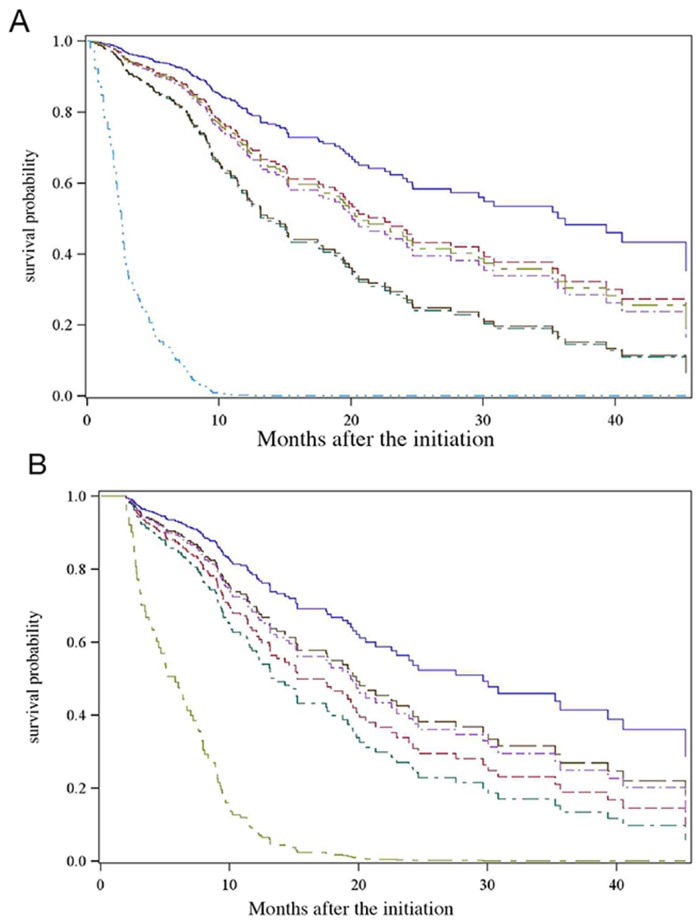
Figure 2. Kaplan-Meier estimates of survival curves with advanced BCLC-C HCC.
(A) Kaplan-Meier estimates of survival curves with advanced BCLC-C HCC, depending on the presence of the identified independent prognostic factors. (A) No independent risk factor.  ; (B) BMI < 25 kg/m2.
  ; (C) Macroscopic vascular invasion
  .; (D) SII > 600.109.
  ; (E) Child-Pugh B
  ; (F) AST > 38 UI/L.
  ; (G) Presence of all risk factors
  . (B) Kaplan-Meier estimates of survival curves with advanced BCLC-C HCC in the subgroup of CP-A patients, depending on the presence of the identified independent prognostic factors. (A) no independent risk factor.
  ; (B) BMI < 25 kg/m2.
  ; (C) macroscopic vascular invasion.
  ; (D) SII > 600.109.
  ; (E) AST > 38 UI/L.
  ; of all risk factors
  .
.

