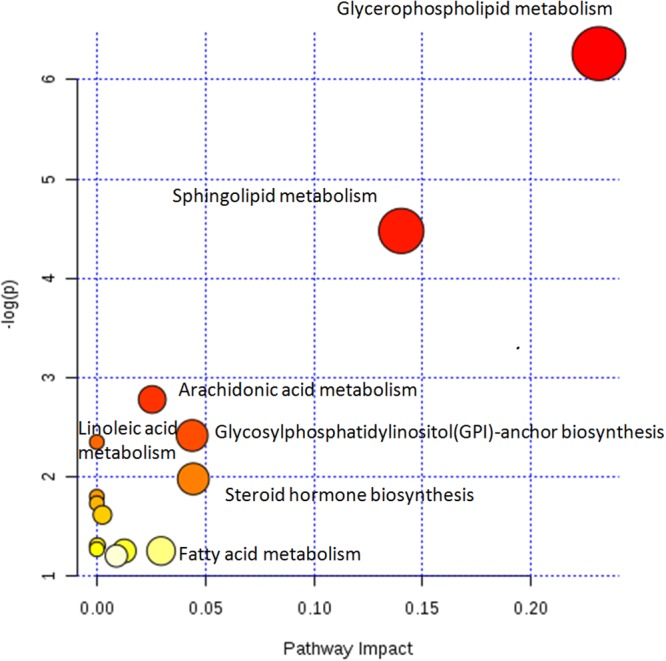
Figure 6. Disturbed metabolic pathways showed various metabolism changes when comparing psoriasis and control.

The metabolic pathway analysis was an integrating enrichment analysis based on the human metabolic pathways. The different color and size of the symbol means the different level of significance, there were more potential biomarkers in the data were involved in the pathway, the color was darker or the size was larger. Glycerophospholipid metabolism, sphingolipid metabolism, arachidonic acid metabolism was most relevant pathways in psoriasis metabolism.
