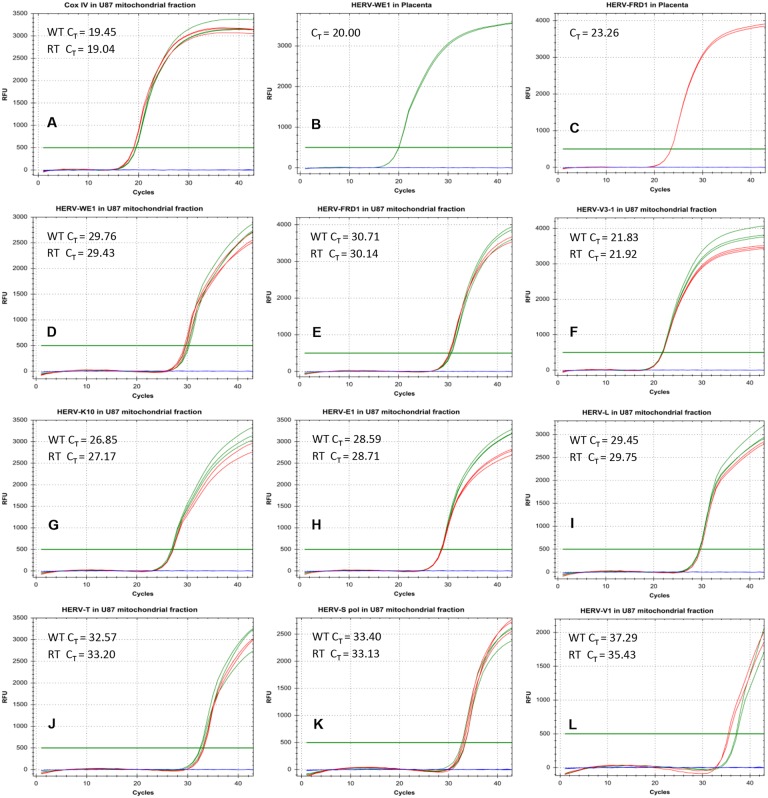
Figure 6. Real-time PCR analysis of HERV-RNA transcripts in the mitochondrial fraction of U87RETO glioblastoma cells.
Figures A-C shows various positive controls (Cox IV in mitochondria and syncytin 1 (HERV-WE1) as well as syncytin 2 (HERV-FRD1) in placenta tissues). In general, we defined a CT < 30 as a standard for positive RNA amplification. This threshold was achieved for CoxIV in mitochondria (picture A), and for syncytin 1 (picture B) and syncytin 2 (panel C) in placenta tissues. In pictures D-L, various HERV-transcripts were analyzed in the mitochondrial fraction. Only for HERV-V3-1 and HERV-K10, the standard for positive transcriptional activity (CT = 21.8) was reached (pictures F and G). Green and red curves represent the RNA from the mitochondrial fraction of untreated and treated cells, respectively. Results were shown for at least 5 independent experiments.

