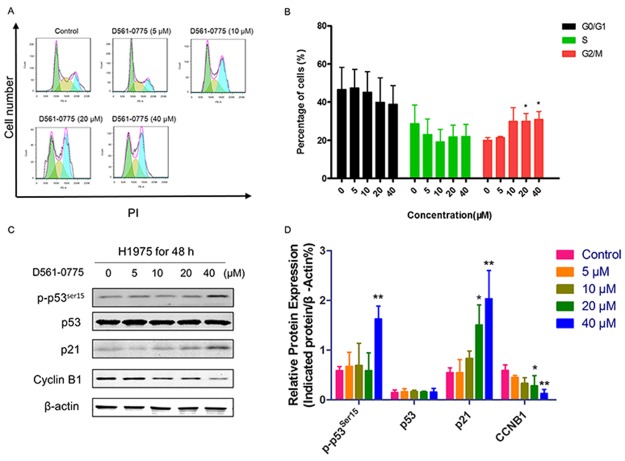
Figure 5. D561-0775 induced cell cycle arrest in H1975 cells.
(A) H1975 cells were treated with D561-0775 at different concentration for 48 h. (B) Statistical analysis of cell cycle distribution after 48 h drug treatment. (C) Western blot analysis of the protein levels of p-p53ser15, p53, p21, Cyclin B1 and β-actin after 48 h drug treatment. (D) Statistical analysis of the densitometry signals of p-p53ser15, p53, p21 and Cyclin B1. All data was presented as mean ± SD (n= 3, * p < 0.05, ** p < 0.01). All western blot images were cropped from full-length blots.

