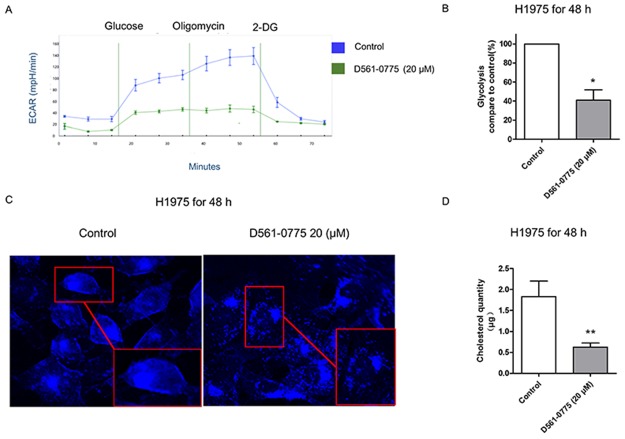
Figure 6. D561-0775 suppressed glycolysis and cholesterol synthesis in H1975.
(A) The ECAR value decreased after treatment with D561-0775 for 48 h. (B) The statistical analysis result of glycolysis for 48 h. (C) Cholestrol staining after incubating with D561-0775 at 20 μM on H1975 for 48 h, magnified 40X dimension. (D) Quantification of the cholestrol level of H1975 after 48 h treatment with D561-0775. All data were presented as mean ± SD (n = 3, *p < 0.05, ** p < 0.01).

