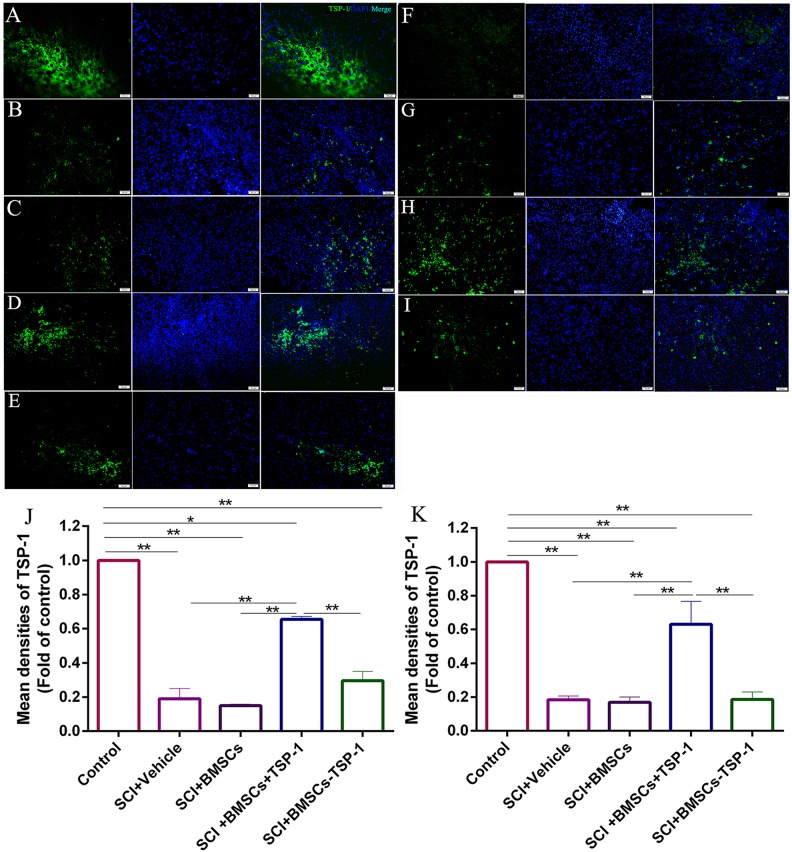
Figure 6.
(A-E, J) The immunofluorescence of TSP-1 in injured spinal cord at 7d after BMSCs transplantation. (A) Control group. (B) SCI+vehicle group. (C) SCI+BMSCs group. (D) SCI+ BMSCs+TSP-1 group. (E) SCI+BMSCs-TSP-1 group. (J) The mean density of TSP-1 in SCI+vehicle, SCI+BMSCs, SCI+BMSCs+TSP-1 and SCI+BMSCs-TSP-1 group. *P<0.05, **P<0.01, one-way ANOVA. Scale bars: 50μm. (A, F-I, K) The immunofluorescence of TSP-1 in injured spinal cord 28 d after BMSCs transplantation. (A) Control group. (F) SCI + vehicle group. (G) SCI + BMSCs group. (H) SCI+BMSCs+TSP-1 group. (I) SCI+BMSCs-TSP-1 group. (K) The mean density of TSP-1 in SCI+vehicle, SCI+BMSCs, SCI+BMSCs+TSP-1 and SCI+BMSCs-TSP-1 group. **P<0.01.

