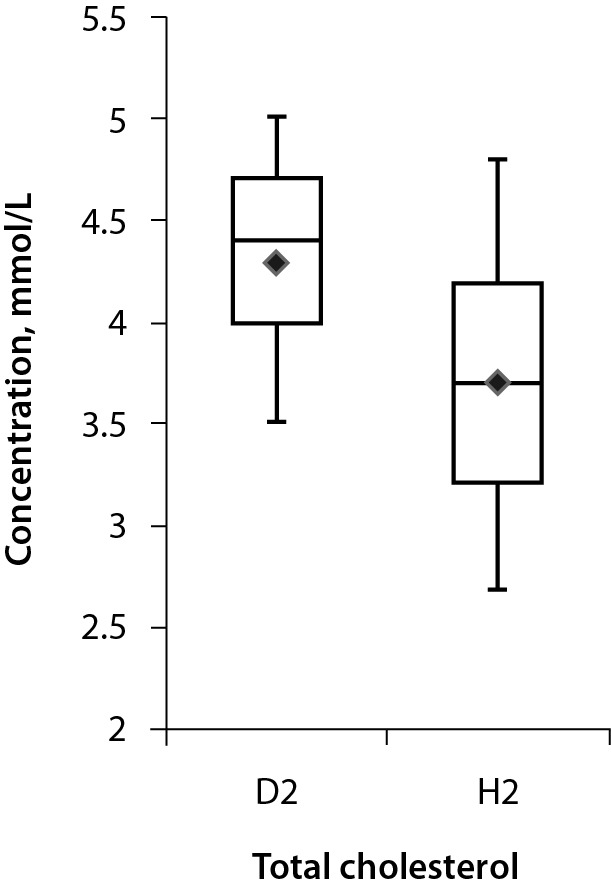
Figure 1.

Box-plot of the test dataset after artificial grouping into diseased (D2) and healthy (H2) individuals. The median (horizontal lines across the box), arithmetic mean (diamond shapes), interquartile ranges (boxes) and minimum and maximum values (whiskers) of the groups are indicated.
