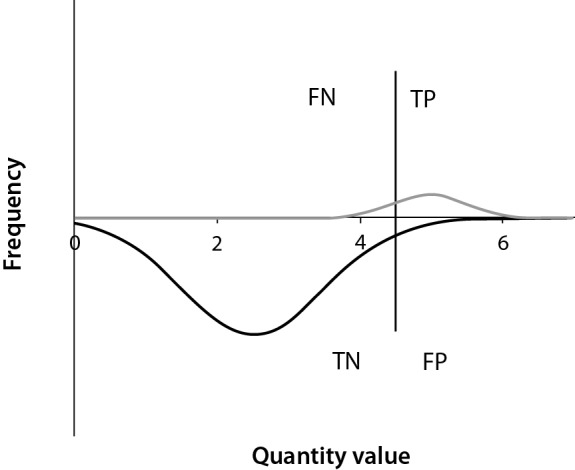
Figure 2.

Graph designed to mimic a contingency table for different outcomes marked. The diseased population is above the X-axis and characterized by high results. The cut-off is marked as a vertical line. Results on the left would be called ”negative” and those on the right ”positive”. Thus, false negatives (FN) are found in the small area under the curve to the left of the cut-off line and above the X-axis. False positives (FP) are found above the curve but under the X-axis to the right of the cut-off. Think of moving the cut-off to a new position and note that both the FN and the FP are changed but in different directions. Nota bene, it is unlikely that the quantity values of the diseased group will be normally distributed.
