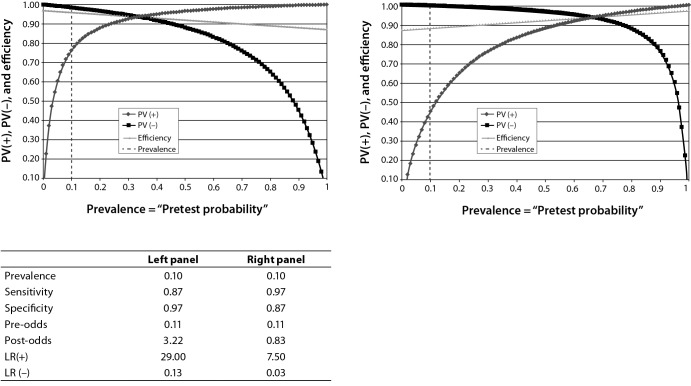
Figure 3.
Outcome in terms of predictive values at a fixed prevalence of 10% and interchanging sensitivity and specificity values. Clearly, if the sensitivity is increased (right panel) the overall performance (efficiency) drops as the likelihood decreases. This favours the ruling out of not diseased, the FN drops. PV (+) – positive predictive value. PV (-) – negative predictive value. LR (+) – positive likelihood ratio. LR (-) - negative likelihood ratio. The vertical dashed line represents the prevalence of disease and increasing the prevalence will improve the performance.

