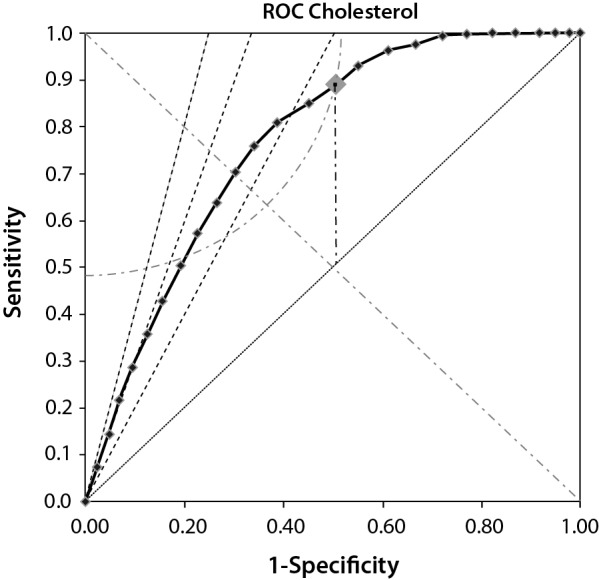
Figure 4.

Indices and help-lines in a ROC diagram. The solid line is the ROC curve with the tested cut-off values indicated. Only points above the equality line (dotted line, Sensitivity = 1 - Specificity) have diagnostic power. The vertical line (dashed-dotted line) is the J-index calculated at the cut-off. The quarter-circle is the K-index at the cut-off and the oblique dashed lines are, from left to right, LR(+) = 4, 3 and 2, respectively.
