
Figure 1. Proteomic analysis of Mtb’s IOP, see also Figure S1.
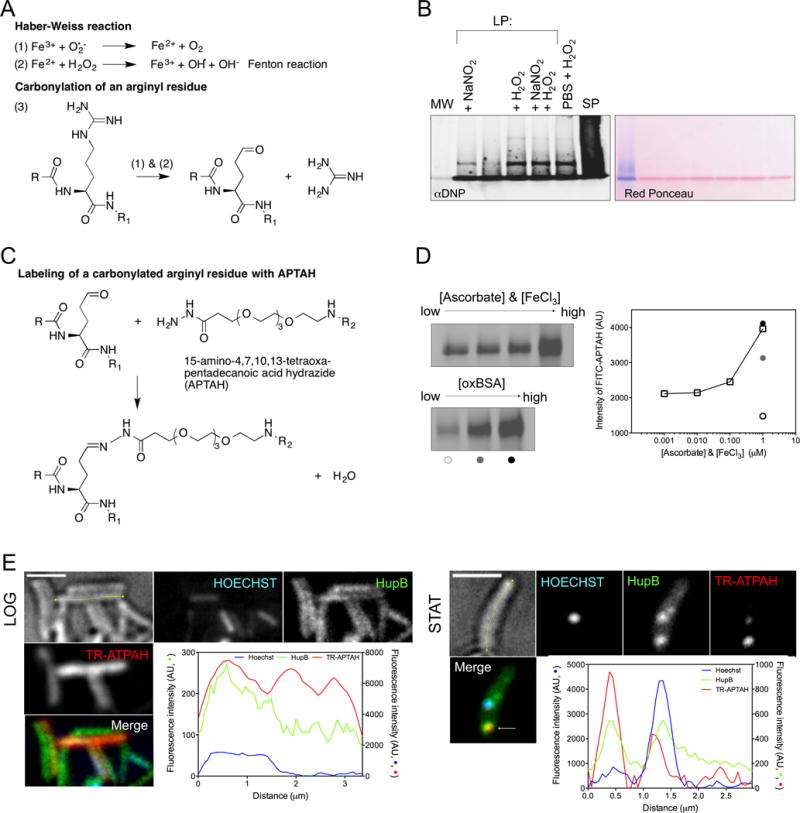
(A) Haber-Weiss chemistry ((1) and (2)) drives OH• generation and addition of carbonyls on amino acid side chains, e.g. an arginyl residue (3).
(B) DNPH-reacted protein samples from Mtb in logarithmic phase (LP) from cultures that were: untreated or supplemented with NaNO2 (3 mM, pH 5.5), H2O2 (5 mM), or a combination of nitrite (0.5 mM) and H2O2 (2.5 mM) at pH 5.5; or subjected to starvation for 1 to 2 weeks in phosphate buffered saline (PBS) and H2O2 (5 mM); or from Mtb in stationary phase (SP) (left panel). Hydrazone derivatives were blotted with anti-DNP antibody. Ponceau red staining served as a loading control (right panel). MW, molecular weight controls that migrated in a single band on 5% SDS stacking gel.
(C) Reaction of fluorophore-derivatized 15-amino-4,7,10,13-tetraoxapentadecanoic acid hydrazide (ATPAH) with carbonyls. R and R1 indicate the N- and C- termini of a protein. R2 represents FITC or Texas red.
(D) Reaction of probe in (C) with oxidized BSA. The amount of staining (first 4 lanes of (D, left)) increased with the concentration of the oxidant pair FeCl3 and ascorbic acid, incubated for 12 h in the equimolar concentrations indicated in (D, right) with BSA. Staining also increased with the quantity of oxidized BSA (125, 250 and 500 ng) as indicated by the open, gray and black circles below the 3 lanes of (D, bottom left) and quantified in (D, right).
(E) Intracellular distribution of HupB, a carbonylated protein, as a fusion with Dendra2 in relation to its carbonylation status (TR-APTAH stain) and the nucleoid (Hoechst) in logarithmic (LOG) and stationary phase (STAT). Intensity of fluorescence (AU) in the 3 channels is quantified along the longitudinal axis (yellow) of representative cells. Inspection of z-planes showed that bright TR-APTAH staining of some LOG cells came from the cell surface. Scale bar, 2 microns.