
Figure 4. Quantitative characterization of ClpB’s association with aggregates in response to kanamycin at the microcolony level, see also Figure S4.
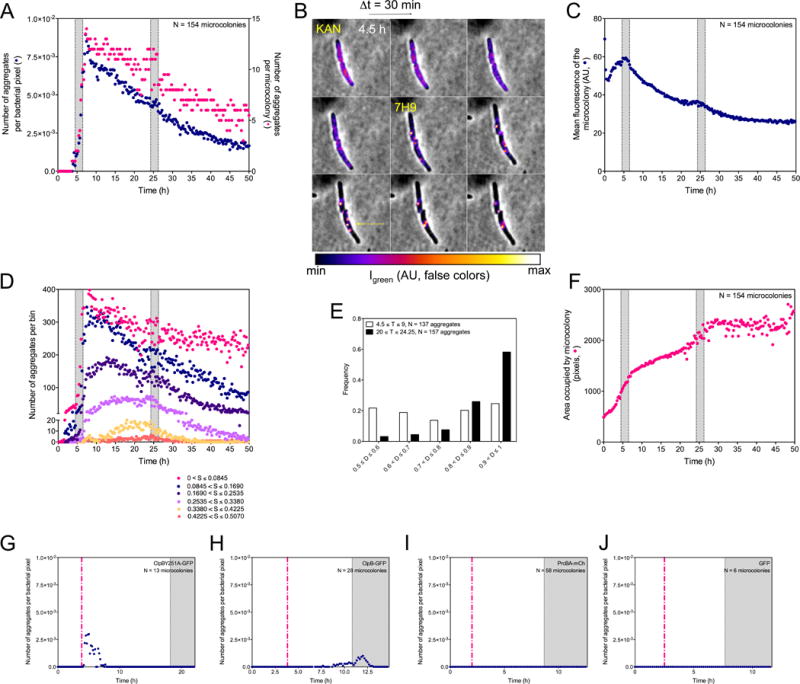
(A, C, D, F, G, H, I and J) Shaded areas indicate incubation of Msm with 1 μg/mL kanamycin (panels A, C, D and F) or 0.1 μg/mL (panels G to J). The same 154 microcolonies were analyzed in (A), (C), (D), (E) and (F). Results in (A), (C), (D), (E) and (F) are compiled from 3 experiments. They are representative of results in >15 additional experiments conducted with variations in the timing of perfusion phases, doses of kanamycin or choice of fluorescent tag. (A) Numbers of aggregates per bacterial pixel over time (blue circles) and numbers of aggregates per microcolony (red circles).
(B) Representative image series (Δt = 30 min) of 2 ΔclpBSm∷clpB-dendra2 cells over 4 h following exposure to 1 μg/mL of kanamycin. Quantitated, false-color fluorescence images superimposed on phase contrast images illustrate an initially relatively diffuse distribution of ClpB-GFP, followed by its accumulation into aggregates in conjunction with its disappearance from the intervening volume of the cell. The upper cell develops 2 aggregates; the lower cell develops 3 that fuse into 1.
(C) Mean fluorescence intensity of microcolonies. The mean intensity of fluorescence of bacterial pixels (navy blue) was corrected for photobleaching as in Figure S5A.
(D) Numbers of aggregates of different sizes (S) over time.
(E) Tendency of ClpB-associated aggregates to collect at a pole. The histogram represents the frequency distribution (y-axis) of aggregates’ localization in ΔclpBSm∷clpB-dendra2 as a function of time in relation to kanamycin exposure on the long axis of each cell, where distances (D) of 0.50 and 1.00 on the x-axis represent mid-cell and a cell pole, respectively. T = time period analyzed in hours.
(F) Growth of microcolonies. The number of bacterial pixels (red circles) was summed over time.
(G to J) Numbers of aggregates per bacterial pixel over time (purple circles). Expression of fluorescent controls was induced by pulse perfusion with Atc (dashed red line; 200 ng/mL).
(G) Failure of ClpBY251A-GFP to enter aggregates in response to 0.1 μg/mL of kanamycin. Transient appearance of fluorescent patches after Atc was attributable to the fluorescence of Atc.
(H) Tendency of ClpB-GFP expressed in Msm with strictly similar genetic background as in (G) to enter aggregates in response to 0.1 μg/mL of kanamycin.
(I) Failure of PrcA-mCherry to enter aggregates in response to 0.1 μg/mL of kanamycin. Msm expressed PrcA-mCherry and PrcB (heptamers in stacks of 4) in response to pulse perfusion with Atc.
(J) Failure of GFP not fused with ClpB to enter aggregates in response to 0.1 μg/mL of kanamycin.