
Figure 6. Heterogeneous distribution of ClpB-GFP within mycobacteria and between their progeny in response to a sublethal concentration of INH.
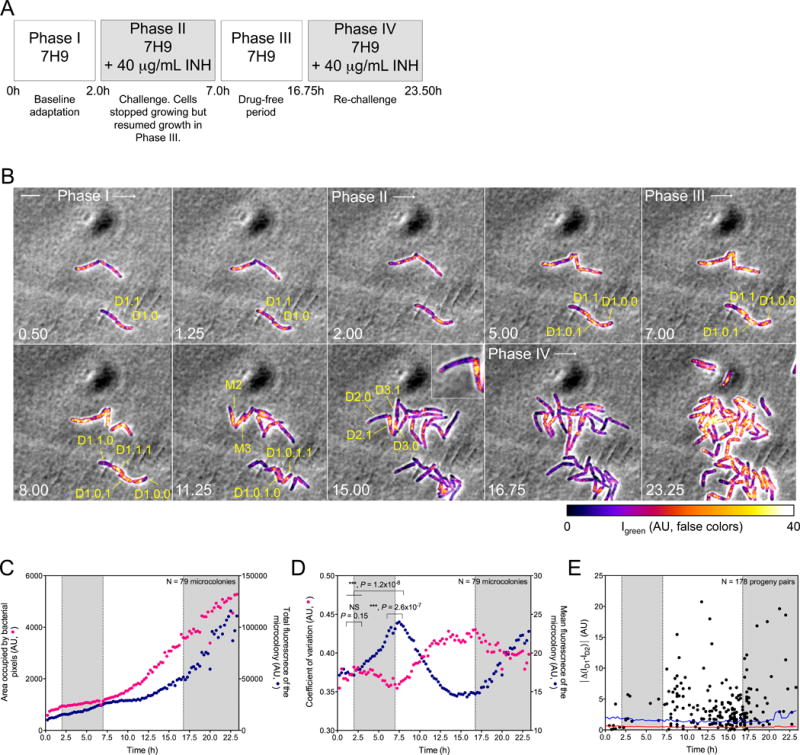
(A) Perfusion paradigm. 7H9, Middlebrook 7H9 medium. INH, isoniazid (40 μg/mL). Shaded phases II and IV correspond to shading in panels (C–E).
(B) Representative image series for each phase in (A). Numbers indicate time in hours. Scale bar, 4 μm. False-colored fluorescence intensity, corrected for photobleaching, Decimals denote lineages of parental cells (M) and their descendants (D). Thus, M1’s descendant D1.1 gave rise to D1.1.0, which inherited few patches of ClpB, and D1.1.1, which inherited most of the patches of ClpB. Likewise, D2.0 inherited almost no detectable ClpB from M2, while D2.1 (see inset) inherited almost all of it. Results were similar for the descendants of M3.
(C) Relation of microcolony growth to expression of ClpB-GFP. Median growth of 79 microcolonies (yellow circles; total bacterial pixels) is shown on a linear scale in relation to incubation with INH. Summed intensity of ClpB-GFP fluorescence is denoted on a linear scale by blue circles (AU). Total expression of ClpB-GFP increased much more slowly than microcolony biomass, but increased fastest when colony growth slowed.
(D) Quantitative characterization of formation of ClpB-GFP into patches following exposure of Msm microcolonies to INH. As mean fluorescence (fluorescence intensity divided by bacterial pixels; blue circles) of the microcolonies decreased, the median coefficient of variation (σ/μ) of the mean fluorescence increased (red circles). Significance was evaluated by Kolmogorov-Smirnov test for continuous distribution as the null hypothesis.
(E) Quantitative characterization of asymmetric distribution of patched ClpB to progeny following exposure of Msm to sublethal INH. Each dot corresponds to the absolute value of the difference in ClpB fluorescence mean intensities at birth (|ΔMD1-|D2)|) between members of a progeny pair, ID1 and ID2. This is compared to the mean (red line) of the difference in background fluorescence, calculated as the difference in fluorescence mean intensities of two adjacent areas that were external to cells, identical to each other in size, and similar in size to a bacterium. This background value was calculated every 15 min over 23.5 h for 17 movies from 3 independent experiments. Blue line indicates a confidence level > 99.9% (p < 0.004).