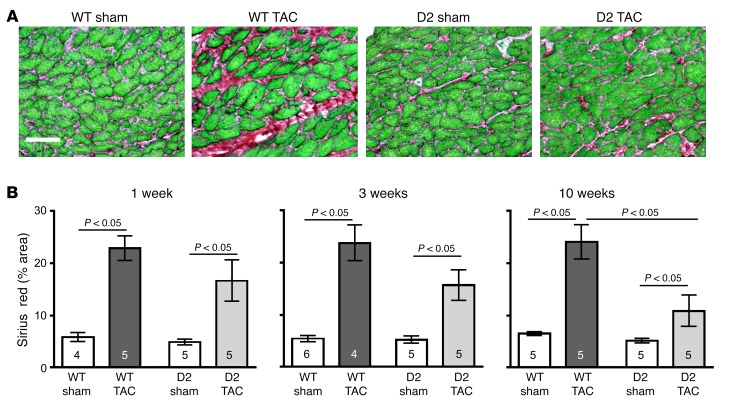
Figure 6. Reduced myocardial fibrosis in D2 mice after TAC surgery.
(A) Representative heart sections stained with Sirius red/fast green from a WT and D2 mouse at 10 weeks following sham or TAC surgery. Scale bar: 50 μm. (B) Quantification of myocardial fibrosis in WT and D2 hearts at 1, 3, and 10 weeks following sham or TAC surgery (peri-vascular regions were excluded from the analyses). Statistical analysis: 2-way ANOVA followed by the Bonferroni procedure. Numbers within bars are the numbers of animals examined.

