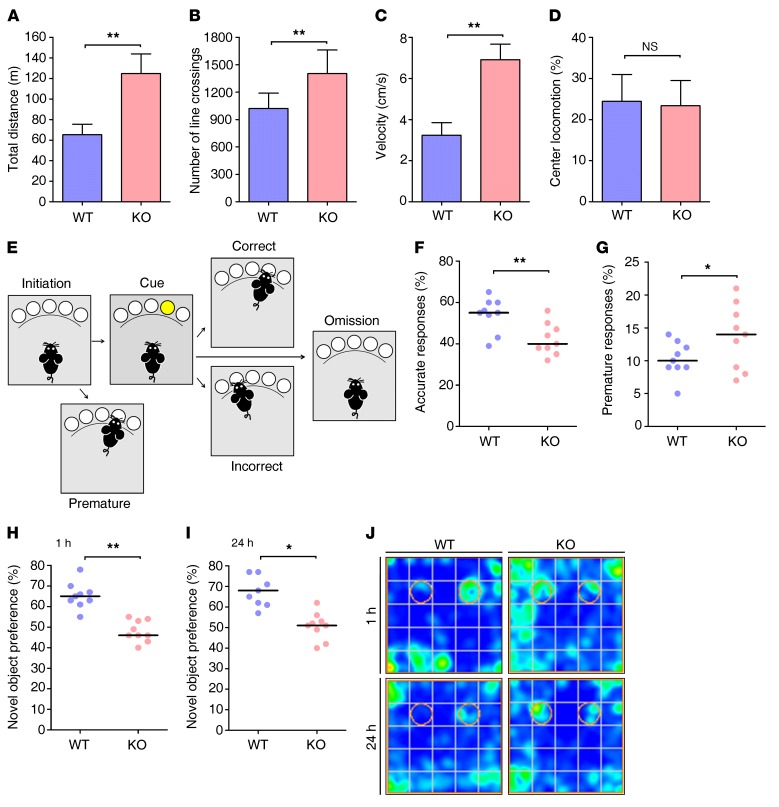
Figure 1. Ndrg2–/– mice display ADHD-like symptoms.
(A–D) The locomotor activity of 2-month-old WT and Ndrg2–/– mice in an open field is presented as the total distance traveled (A), number of lines crossed (B), velocity (C), and locomotion in the center of the field (D). n = 10 KO; n = 9 WT. **P < 0.01, Student’s t test. (E–G) Attention and impulsivity were detected in the WT and Ndrg2–/– mice with a visual 5-CSRTT (E) and are represented by the accuracy percentage (F) and premature response percentage (G), respectively. n = 9 KO; n = 9 WT. *P < 0.05; **P < 0.01, Wilcoxon’s rank sum test. (H–J) The short-term (H) and long-term (I) memory of the WT and Ndrg2–/– mice were examined with the novel object recognition test. (J) Heatmaps show the time spent exploring both familiar and novel objects. The circles represent the objects’ locations. n = 9 KO; n = 9 WT. *P < 0.05; **P < 0.01, Wilcoxon’s rank sum test. Error bars indicate mean ± SEM (A–D). Horizontal bars indicate medians (F–I).

