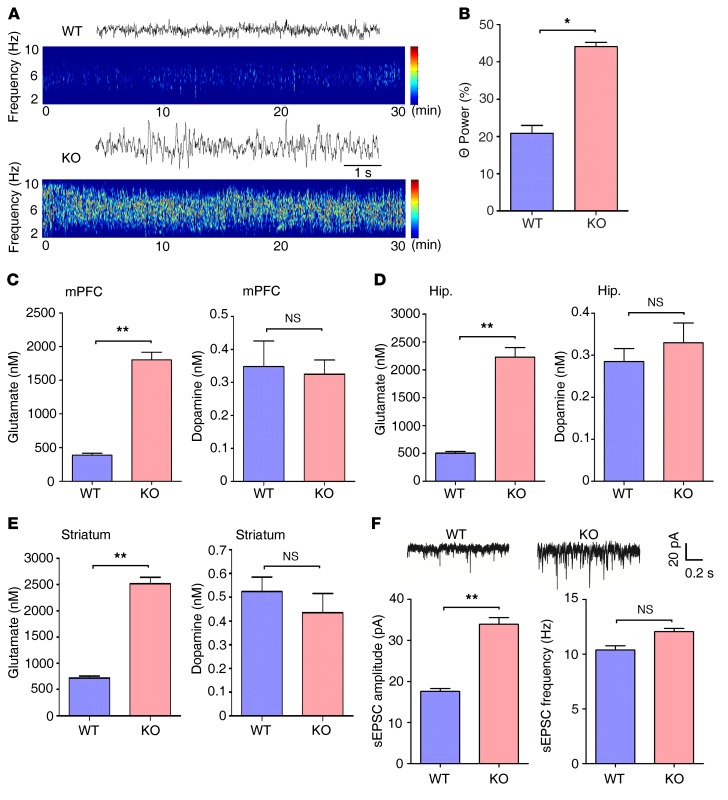
Figure 2. Enhanced excitatory transmission in the Ndrg2–/– brain.
(A) Representative traces and spectrogram of θ EEG rhythms in WT and Ndrg2–/– mice. (B) Quantitative θ rhythm percentage of the total EEG in the frontal cortex of the WT and Ndrg2–/– mice. n = 6 KO; n = 6 WT. *P < 0.05, Wilcoxon’s rank sum test. (C–E) Measurements of interstitial glutamate and dopamine concentrations in the mPFC (C), hippocampus (Hip.) (D), or striatum (E) of WT and Ndrg2–/– mice. n = 6 per group. **P < 0.01, Student’s t test. (F) Representative sEPSC recordings in the WT and Ndrg2–/– hippocampal CA1 pyramidal neurons (upper trace). Amplitudes and frequencies of the sEPSCs (lower histogram, left and right, respectively) were quantified. n = 12 per group. **P < 0.01, Student’s t test. Error bars indicate mean ± SEM.

