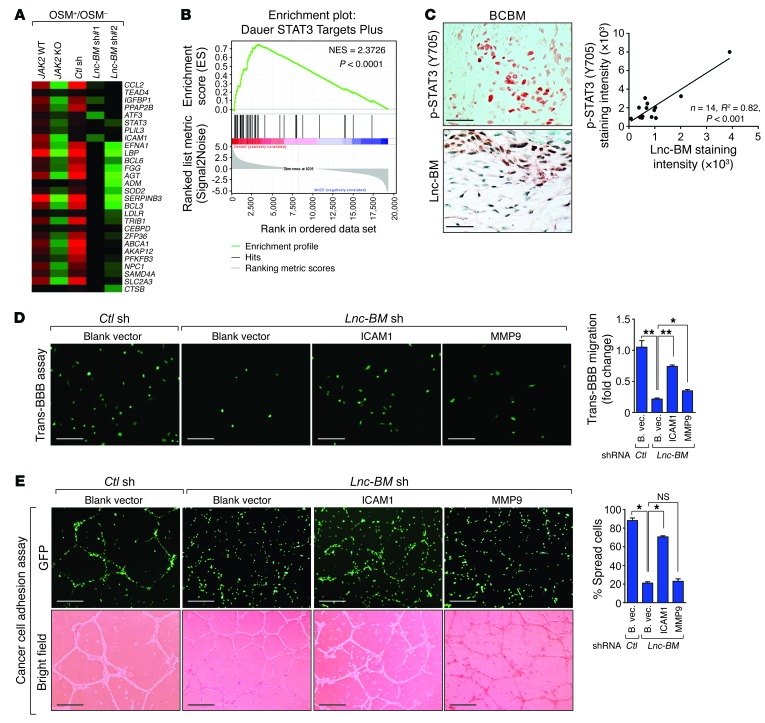
Figure 11. ICAM1 facilitates breast cancer cell vascular co-option and invasion.
(A) Heatmap representation of the expression of STAT3 target genes in indicated cells treated with 50 ng/ml OSM or vehicle for 4 hours. The colors represent the fold changes of gene expression induced by OSM over vehicle. (B) GSEA of STAT3 target gene signature in A. NES, normalized enrichment score. (C) Top panel: Representative images of p-STAT3 and Lnc-BM staining in brain metastatic tissues of breast cancers. Bottom panel: Pearson’s correlation analysis (n = 14 tissues). Scale bars: 100 μm. (D and E) Trans-BBB assay (D) or cancer cell adhesion assay (E) was performed in Lnc-BM–deficient 231-Br cells stably overexpressing ICAM1 and MMP9 (n = 3 independent experiments, paired Student’s t test). B. vec., blank vector. Scale bars: 100 μm (D), 200 μm (E). Data are mean ± SEM; NS, P > 0.05; *P < 0.05, **P < 0.01.

