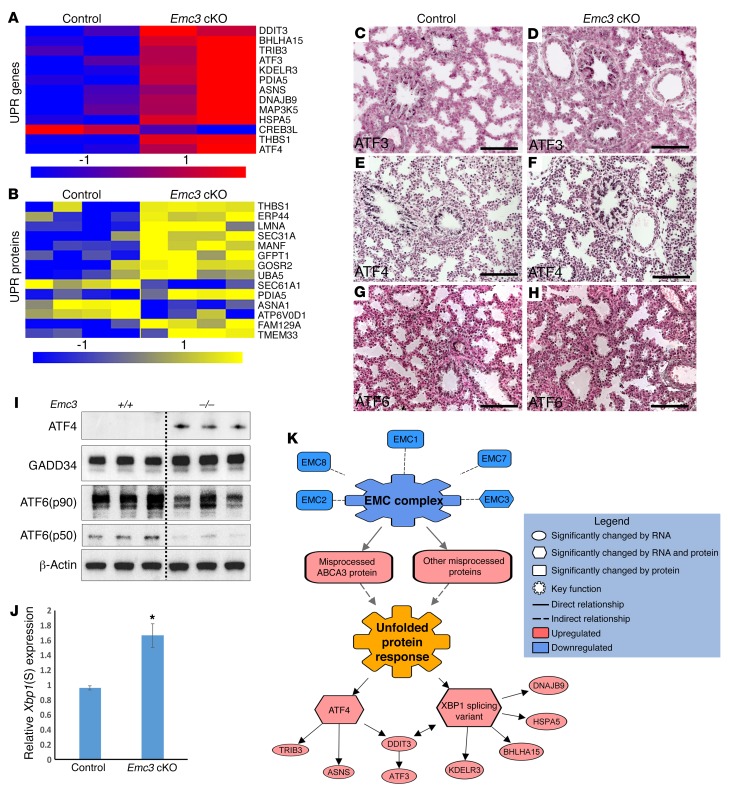
Figure 5. Loss of Emc3 induced the unfolded protein response in EpCAM+ sorted epithelial cells.
(A and B) Heatmap of the mRNAs (A, blue/red) and proteins (B, blue/yellow) involved in the UPR pathway are shown. Proteomic and RNA sequencing data were obtained from EpCAM+ sorted epithelial cells from control and Emc3-cKO mice at E18.5. Genes and proteins were categorized by ToppGene. P values and fold changes for each mRNA and protein are listed in Supplemental Table 2. (C–H) Immunohistochemical staining for ATF3 (C and D), ATF4 (E and F), and ATF6 (G and H) was performed on lung sections from E18.5 control and Emc3-cKO embryos. ATF3 and ATF4 staining was increased and ATF6 staining was unaltered in the mutant lungs. Scale bars: 100 μm. (I) Western blots using EpCAM+ cell lysates from control and mutant lungs at E18.5 were performed using the indicated antibodies. (J) Increased Xbp1 splicing in Emc3-cKO mice. Levels of the spliced Xbp1 transcript [Xbp1(S)] were normalized to that of the full-length Xbp1 by qPCR. mRNAs were isolated from E18.5 control and Emc3-cKO EpCAM+ cells. Data are the mean ± SEM. *P < 0.05 using unpaired, 2-tailed Student’s t test. n = 4/group. (K) Model for the induction of UPR in Emc3-cKO AT2 cells. The model was built based on the integration of RNA sequencing and proteomic data. Relationships between differentially expressed genes and proteins were determined by Genomatix Pathway System (GePS) and Ingenuity Pathway Analysis (IPA) suites. System models were created using IPA’s Path Designer.

