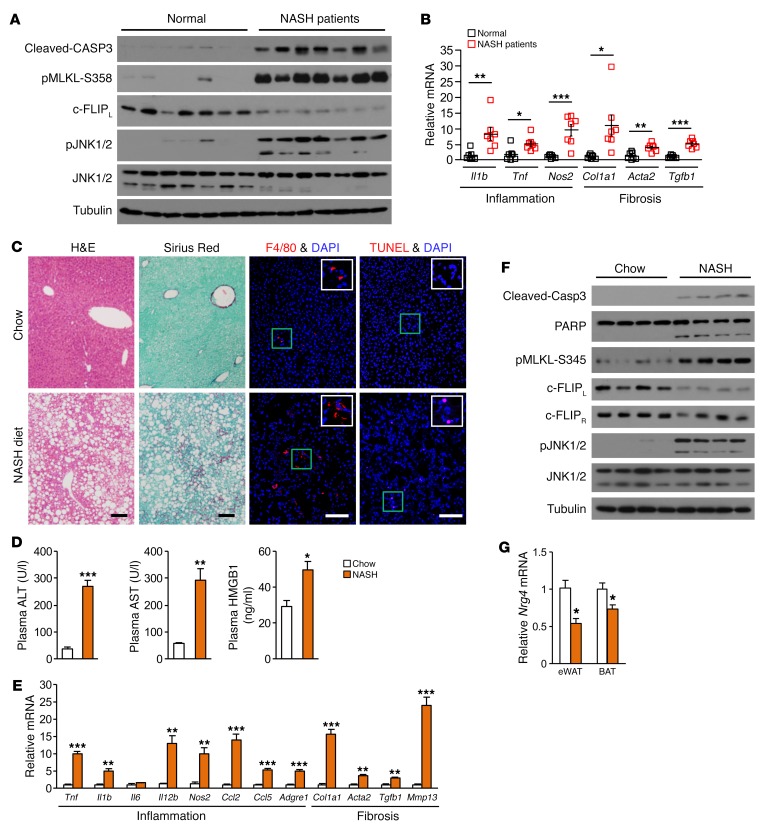
Figure 1. Human and mouse NASH are linked to induction of apoptosis and necroptosis in the liver.
(A) Immunoblots of total liver lysates from normal individuals and NASH patients. (B) qPCR analysis of gene expression in normal (n = 7) and NASH (n = 7) human livers. Data represent mean ± SEM. *P < 0.05; **P < 0.01; ***P < 0.001, 2-tailed unpaired Student’s t test. (C) H&E, sirius red, F4/80 immunofluorescence, and TUNEL staining of liver sections from male C57BL/6J mice fed chow or NASH diet. Scale bars: 100 μm. (D) Plasma ALT, AST, and HMGB1 levels in mice fed chow (n = 4) or NASH diet (n = 4). Data represent mean ± SEM. *P < 0.05; **P < 0.01; ***P < 0.001, 2-tailed unpaired Student’s t test. (E) qPCR analysis of hepatic gene expression. Data represent mean ± SEM. **P < 0.01; ***P < 0.001, 2-tailed unpaired Student’s t test. (F) Immunoblots of total liver lysates from mice fed chow or NASH diet. (G) qPCR analysis of Nrg4 expression in eWAT and BAT. Data represent mean ± SEM. *P < 0.05, 2-tailed unpaired Student’s t test.

