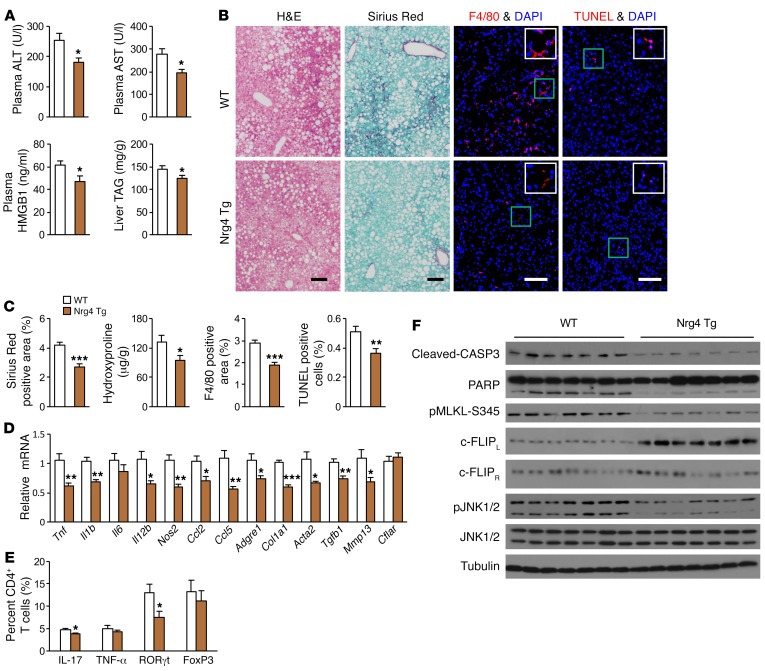
Figure 3. Tg restoration of the Nrg4 endocrine axis protects mice from diet-induced NASH.
Control WT (n = 13, white) and Nrg4-Tg (n = 9, brown) male mice were fed a NASH diet for 20 weeks, starting at 3 months of age. (A) Plasma ALT, AST, and HMGB1 levels and liver TAG content. Data represent mean ± SEM. *P < 0.05, 2-tailed unpaired Student’s t test. (B) H&E, sirius red, F4/80 immunofluorescence, and TUNEL staining of liver sections. Scale bars: 100 μm. (C) Quantification of the sirius red, F4/80, and TUNEL staining images and liver hydroxyproline content. Data represent mean ± SEM. *P < 0.05; **P < 0.01; ***P < 0.001, 2-tailed unpaired Student’s t test. (D) qPCR analysis of hepatic gene expression. Data represent mean ± SEM. *P < 0.05; **P < 0.01; ***P < 0.001, 2-tailed unpaired Student’s t test. (E) Flow cytometry analysis of liver CD4+ T cells. Results are expressed as percentage (%) of IL-17+, TNF-α+, RORγt+, and FOXP3+ cells in total liver CD4+ T cells. Data represent mean ± SEM. *P < 0.05, 2-tailed unpaired Student’s t test. (F) Immunoblots of total liver lysates from NASH diet–fed mice.

