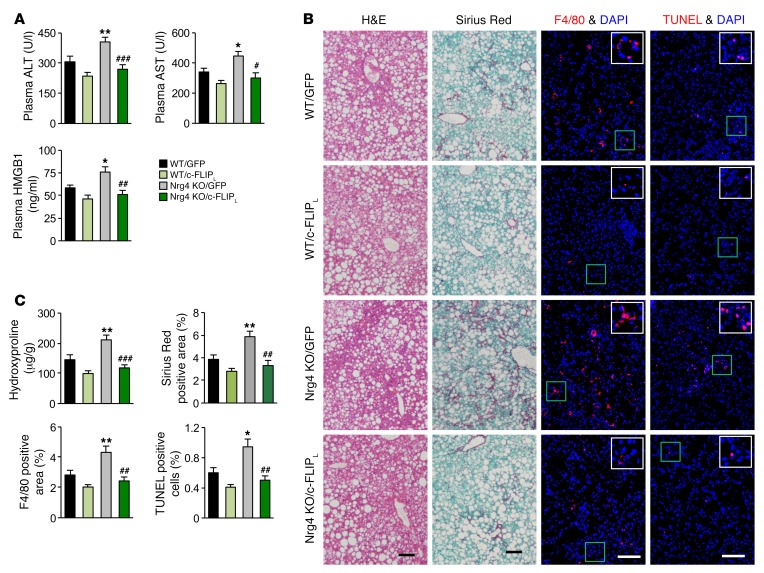
Figure 7. AAV-mediated restoration of hepatic c-FLIPL alleviates NASH phenotype in Nrg4-deficient mice.
The following parameters were measured in WT and Nrg4-KO male mice fed NASH diet for a total of 20 weeks. AAV8-GFP and AAV8–c-FLIPL vectors were administered 8 weeks following the initiation of NASH feeding. WT/GFP group, n = 8; WT/c-FLIPL group, n = 7; Nrg4-KO/GFP group, n = 8; Nrg4 KO/c-FLIPL group, n = 7. (A) Plasma ALT, AST, and HMGB1 levels. Data represent mean ± SEM. *P < 0.05, **P < 0.01, WT/GFP vs. Nrg4-KO/GFP; #P < 0.05, ##P < 0.01, ###P < 0.001, Nrg4-KO/GFP vs. Nrg4-KO/c-FLIPL, 1-way ANOVA. (B) H&E, sirius red, F4/80 immunofluorescence, and TUNEL staining of liver sections. Scale bars: 100 μm. (C) Quantification of sirius red, F4/80, and TUNEL staining images and liver hydroxyproline content. Data represent mean ± SEM. *P < 0.05, **P < 0.01, WT/GFP vs. Nrg4 KO/GFP; ##P < 0.01, ###P < 0.001, Nrg4 KO/GFP vs. Nrg4 KO/c-FLIPL, 1-way ANOVA.

