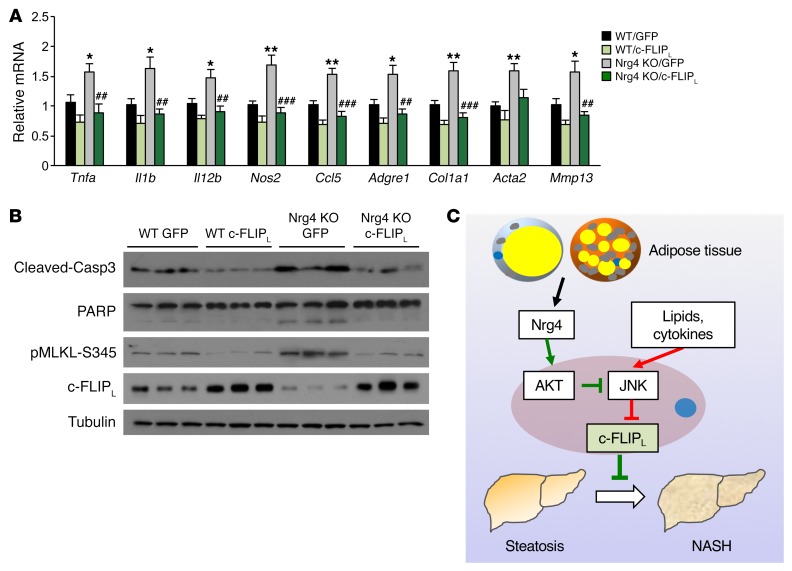
Figure 8. AAV-mediated restoration of hepatic c-FLIPL attenuates liver inflammation and cell death.
The following parameters were measured in mice as described in the Figure 7 legend. (A) qPCR analysis of hepatic gene expression. Data represent mean ± SEM. *P < 0.05, **P < 0.01, WT/GFP vs. Nrg4 KO/GFP; ##P < 0.01, ###P < 0.001, Nrg4 KO/GFP vs. Nrg4 KO/c-FLIPL, 1-way ANOVA. (B) Immunoblots of total liver lysates. (C) Model depicting Nrg4-mediated endocrine signaling as a checkpoint for steatosis-to-NASH progression. Hepatic Nrg4 signaling counters c-FLIPL downregulation in response to lipotoxic and inflammatory stress, thereby preserving hepatocyte health and blocking the transition from hepatic steatosis to NASH.

