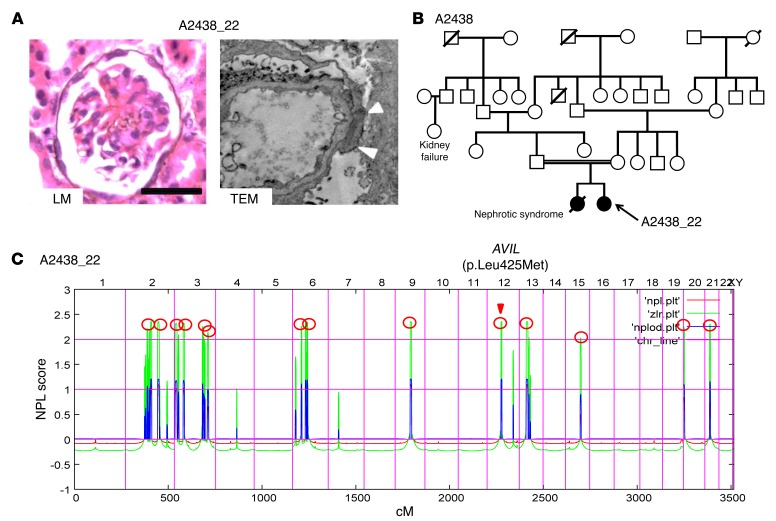
Figure 1. Renal histology, pedigree analysis and homozygosity mapping in family A2438 diagnosed with SRNS.
(A) Renal histology of individuals with AVIL mutation. Renal histology by light microscopy (LM) from individual A2438_22 with PAS staining showed DMS (scale bars: 50 μm). Transmission electron microscopy (TEM) image from individual A2438_22 showed diffuse foot process effacement (arrowheads). Original magnification, ×7,000. (B) Pedigree for index family A2438. Squares represent males, circles females, black symbols indicate affected persons, and white symbols designate unaffected persons. The double line indicates the consanguineous family. (C) Homozygosity mapping identified recessive candidate loci. In individual A2438_22 with SRNS, nonparametric lod (NPL) scores were calculated and plotted across the human genome. The x axis plots Affymetrix 250K StyI array SNP positions on human chromosomes concatenated from p-ter (left) to q-ter (right). Genetic distance is given in centimorgans (cM). Maximum NPL peaks (red circles) indicate 14 candidate regions of homozygosity by descent as recessive candidate loci. The AVIL locus (arrowhead) is positioned within one of the maximum NPL peaks on chromosome 12q.

