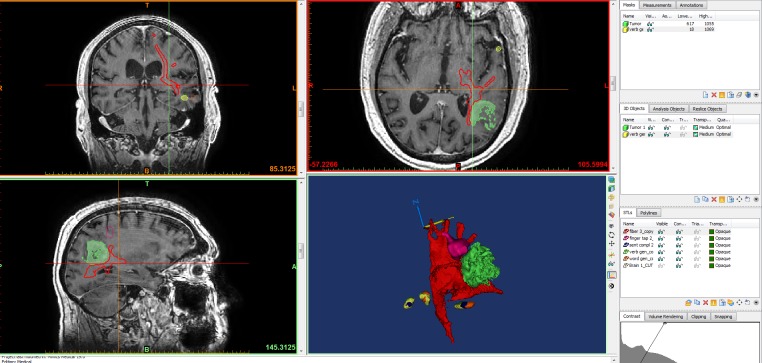
Figure 1. Multimodality 3D superposition.
T1 three-dimensional (3D) data is used as the anatomical base, and the data sets yielded from functional magnetic resonance imaging (fMRI) and tractography are assembled on and fused with the brain; tumor (green), fiber tracts (red), fMRI data (pink, yellow). Blue and yellow arrows are arrows of axes. Blue "N" represents "north direction."

