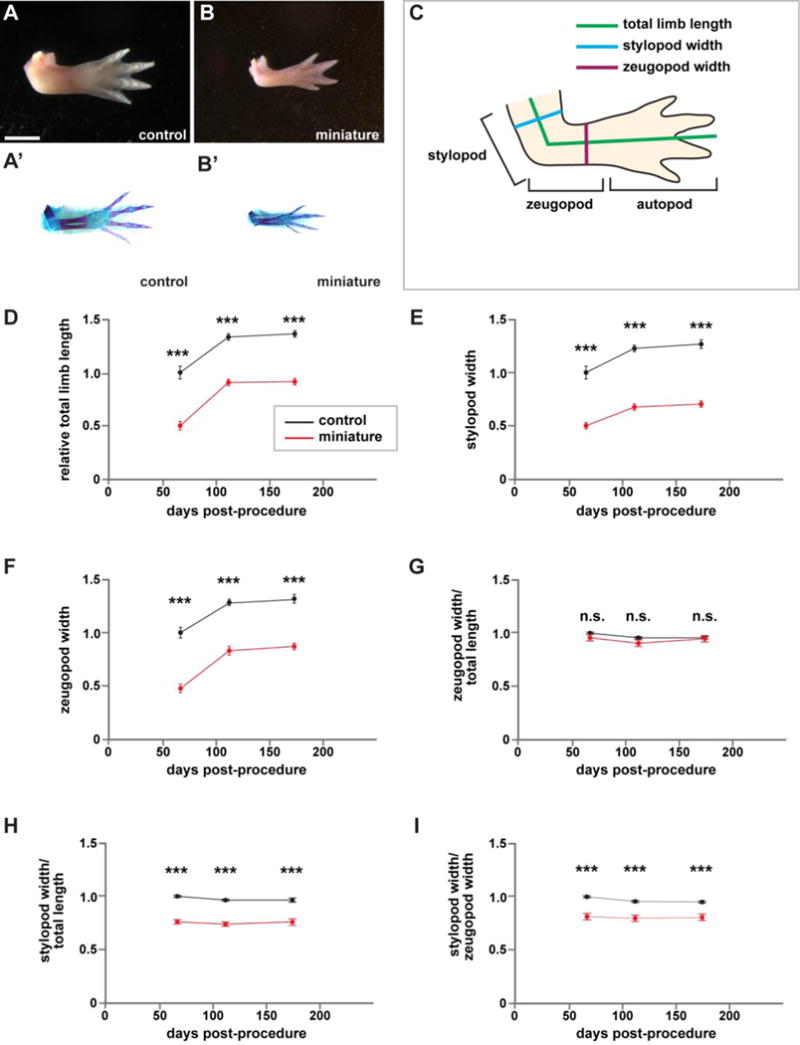
Figure 2. Miniaturized limbs are structurally normal.

Structural and morphological analysis of miniaturized and control limbs. If an animal had two forelimbs, then the measurements of the two limbs were averaged to generate a single measurement for each animal. (A–B) Representative whole-mount images of control (A) and miniature limbs (B), dorsal view, anterior at top. (A’–B’) Skeletal preparations of corresponding limbs in (A–B). (C) Schematic for quantifications. (D–I) Quantification of limb attributes over time, normalized to sibling controls at 66 days post-procedure (amputation for control siblings, last removal of bud-like structure for miniature limbs). N=13 control animals; n=10 animals with miniaturized limbs. (D) Total limb length. (E) Stylopod width. (F) Zeugopod width. (G) Stylopod width/total length. (H) Zeugopod width/total length. (I) Stylopod width/zeugopod width. Measurements are mean +/− s.e.m., ***adjusted p-val<0.001, n.s. not significant. A two-way repeated measures ANOVA was used to test differences between groups and time. Post-hoc analyses using Bonferroni’s Multiple Comparisons Test were performed to test differences between control and mini-limbs at each time point and to adjust for multiple comparisons. Scale bar refers to images (A–B’) and is equal to 5 mm.
