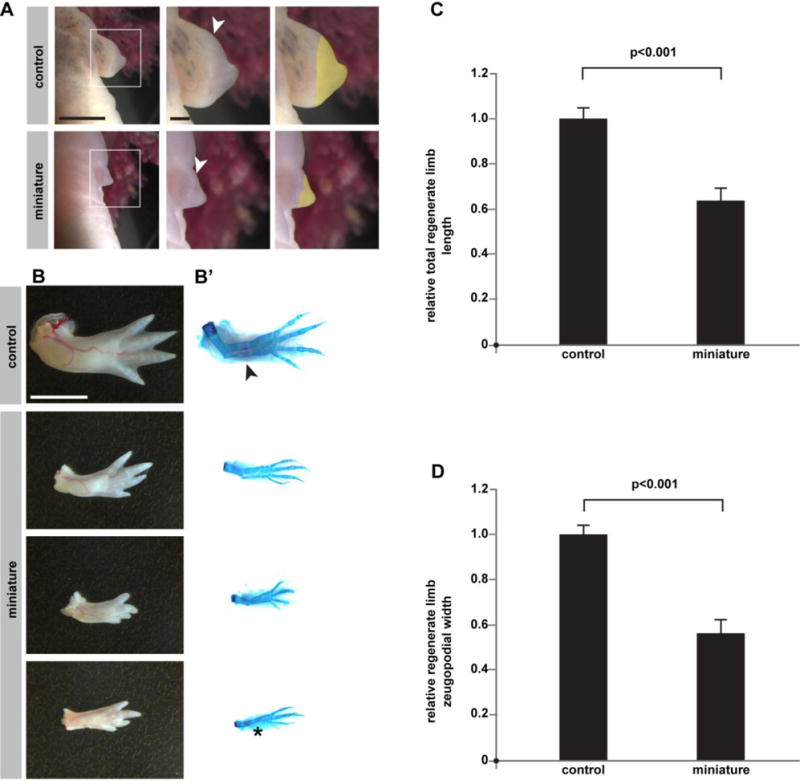
Figure 4. Miniaturized limbs regenerate small limbs following amputation.

Morphological analysis of miniature and control limbs following amputation. (A) Representative images of blastemal formation at 23 days post-amputation. White arrowheads indicate the plane of amputation plane, and yellow highlights indicate each blastema’s area. (B–B’) Dorsal view of representative morphological outcomes at ~11 weeks post-amputation. Left column (B) is whole-mount, and right column (B’) is skeletal preparation of same limbs. Arrow indicates ossification in control. Asterisk indicates loss of ulna. (C–D) Quantification of regenerated limb sizes (n=12 control animals/24 forelimbs; n=8 mini-limb animals/10 forelimbs). (C) Total relative regenerate limb length (p<0.001). (D) Relative zeugopodial width (p<0.001). Measurements are mean +/− s.e.m. A two-tailed t-test was used to assess significance. Scale bar in top-left image of (A) equals 5 mm and applies to left-most images. Scale bar in top-middle image of (A) is 1 mm and applies to middle and right-most images. For (B), scale bar equals 5 mm. The miniature limbs challenged to regenerate in this figure were formed after 36 bud removals.
