Fig. 3.

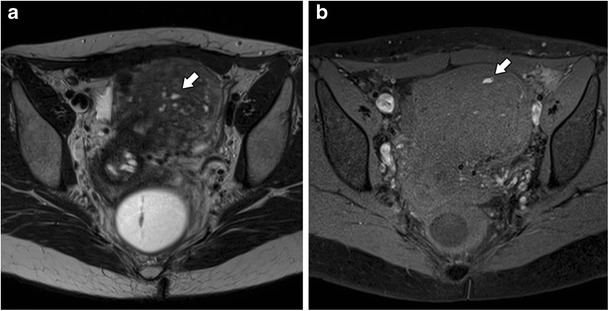
Focal adenomyosis: a Axial T2- and b Axial T1 3D FS-weighted images, showing embedded bright foci on T2- and T1 3D FS-weighted images representing haemorrhagic foci (white arrows)

Focal adenomyosis: a Axial T2- and b Axial T1 3D FS-weighted images, showing embedded bright foci on T2- and T1 3D FS-weighted images representing haemorrhagic foci (white arrows)