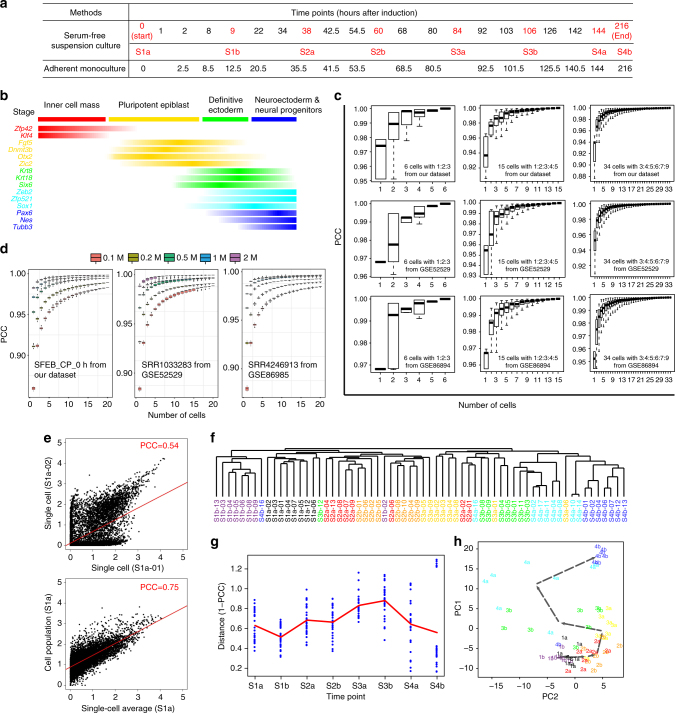
Fig. 1.
Temporal stages of mESC neural differentiation and intercellular heterogeneity. a Time points selected for RNA-seq using two different neuron differentiation methods. The red points are selected for single cell RNA-seq. The “Sxy” pattern is used to label different time points for single-cell RNA-seq, with x representing the stage and y the first a or second b time point within the stage. Stages were defined by marker expression in a (see text for details) and corresponding patterns in cell population RNA-seq. b Expression patterns of each stage’s marker genes and representative neural differentiation marker genes as revealed by RNA-seq. c Saturation curves using simulated cpRNA-seq from different ratios of single-cell RNA-seq data as reference. Single cells are randomly sampled at the indicated coverage (number of cells) and their profile similarities are compared to the simulated cpRNA-seq data generated from 6 cells with 1:2:3 ratio (left), 15 cells with 1:2:3:4:5 ratio (middle), and 34 cells with 3:4:5:6:7:9 ratio (right) using our mESC dataset (top) or two published datasets (middle and bottom). See Methods for details. d Saturation curve after sampling reads at different assumed sequencing depth from 0.1 to 2 million reads (based on sample SRR1033283 from GSE52529, sample SRR4246913 from GSE86985, and sample SFEB_CP_0 h from our dataset, respectively. See Methods for details. e Correlations of gene expression levels (x- and y-axis: log-scale RPKM) between two single cells (left, S1a-01 and Sa1-02), and between the average of 8 single-cell profiles and their corresponding cell population profile (right) across the 11,449 expressed genes (RPKM > 0.5 in at least eight samples). f Unsupervised clustering of single cells based on their expression correlation (measured by PCC) across the 11,449 expressed genes. g The single-cell pairwise differences (1-PCC) in expression patterns during mESC neural differentiation. h Principal component analysis (PCA) of the single cell transcriptomes based on cpDEGs. Eight cells from the same time point are shown with the same color, with the black dotted line connecting the position of average PC1 and PC2 loading of all eight to visualize the temporal progression trajectory

