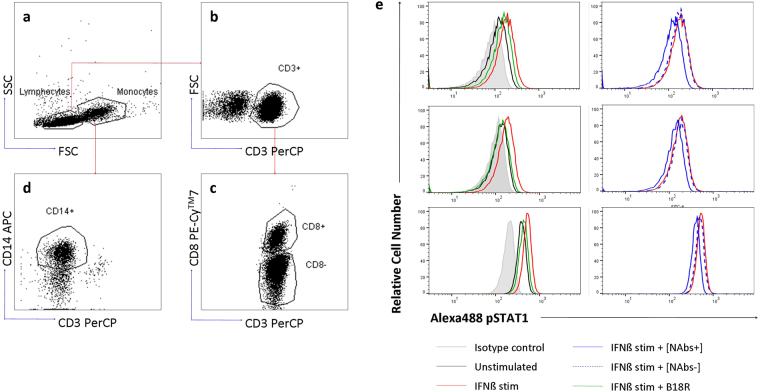
Figure 4.
Gating strategy to determine pSTAT1 expression on different PBMC subsets. Based on the combination of side (SSC) and forward (FSC) light scatter properties of the acquired events, lymphocyte and monocyte gates were selected (a). T lymphocytes were identified by gating on CD3+ cells (b), then, they were transferred to a new dot plot and were analyzed by a specific antibody against CD8. T CD8+ lymphocytes were identified as CD3+ and CD8+ cells and T CD4+ lymphocytes as CD3+ and CD8- cells (c). In a new dot, monocytes were identified as CD14+ and CD3- cells (d). Overlay histograms from a representative patient that depict CD4+, CD8+ T lymphocytes and monocytes expressing pSTAT1 in the different cells stimulation conditions: unstimulated cells (black line), IFNβ stimulated cells (red line), IFNβ stimulated cells in presence of B18R inhibitor (green line), IFNβ stimulated cells in presence of NAbs positive serum (blue line), IFNβ stimulated cells in presence of NAbs negative serum (blue dashed line) and isotype control (shaded histograms) (e). PBMC: peripheral blood mononuclear cells, FSC: forward scatter, SSC: side scatter, PE-Cy7: phycoerythrin-cyanine, PerCP: peridin chlorophyll protein, Alexa488: Alexa Fluor-488, APC: allophycocyanin.

