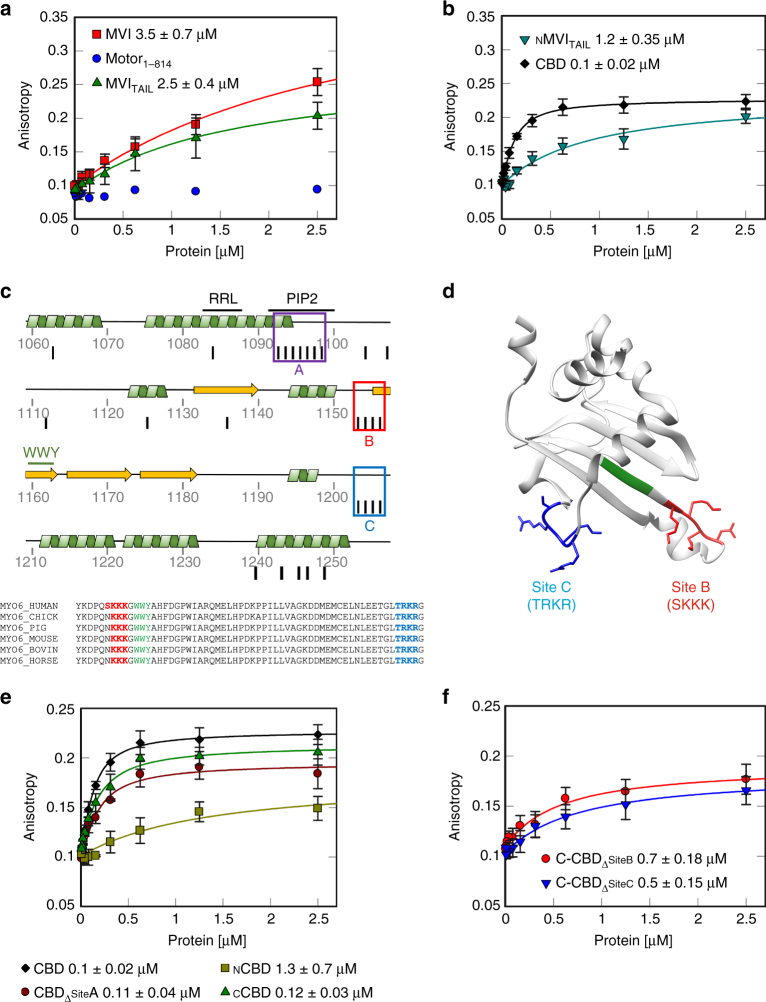
Fig. 2.
DNA binding by myosin VI. a, b Fluorescence anisotropy titrations of MVI domains against a 40 bp fluorescein amidite (FAM)-DNA (50 nM). Data fitting was performed as described in Methods (K d ± SEM n = 3 independent experiments). Due to the low binding affinity, Motor1-814 could not be fitted using the model. c Cartoon depicting the secondary structure within the CBD. Binding partner motifs and known lipid binding sites are highlighted along with three predicted clusters of DNA binding. Black lines represent residues predicted to be involved in DNA binding. Sequence alignment shows the conservation of sites B and C. d Structure of CCBD with site B (red), C (blue) and WWY motif (green) (PDB:2KIA54). e, f Fluorescence anisotropy titrations of CBD constructs, as performed in a

