Figure 6.

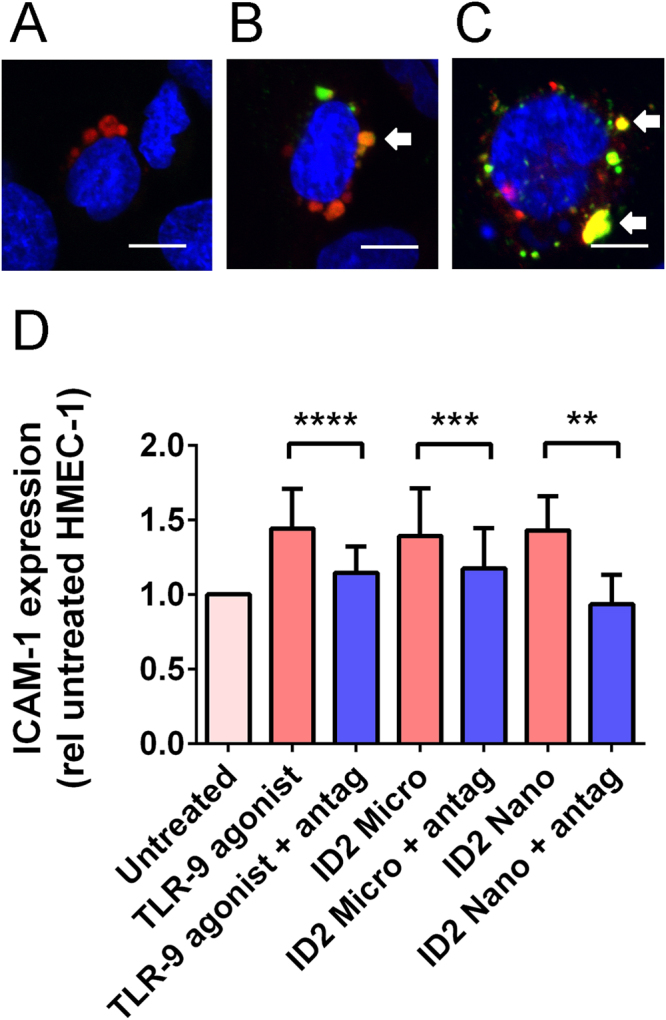
Interactions between placental EVs and TLR-9 of HMEC-1 cells. Optical sections by fluorescence confocal microscopy showing HMEC-1 cells (A) that have been cultured with CellTrackerTM Green CMFDA-labelled placental micro- (B) or nano- (C) vesicles (green). Lysosomes of HMEC-1 cells were labelled with LysoTracker® Red DND-99 (red) and the nuclei of HMEC-1 cells were counterstained with Hoechst (blue). Arrows show areas of co-localisation between placental EVs and lysosomes. Scale bar = 10 µm. Micro- and nano- vesicles collected from ID2-treated placentae were added to HMEC-1 cells with or without a TLR-9 antagonist (1 µM, antag, n = 6 placentae). As a positive control, HMEC-1 cells were treated with a TLR-9 agonist (5 µM). Surface ICAM-1 expression was measured by cell-based ELISA and normalised to that of untreated HMEC-1 cells (D). Statistical difference was assessed by Wilcoxin matched-pairs signed ranked tests (**p < 0.01, ***p < 0.001, ****p < 0.0001).
