Fig. 4.
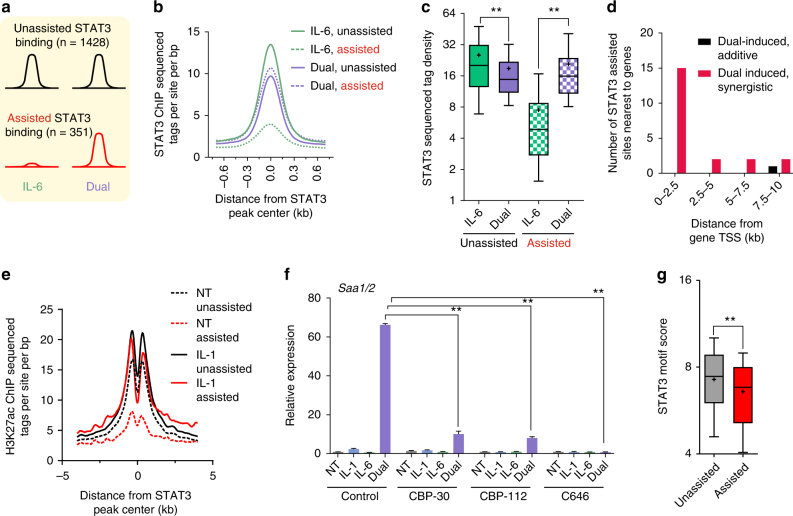
IL-1β primes a subset of enhancers and assists STAT3 loading onto them. a A scheme representing the fraction of STAT3 sites where no significant change in binding was detected between the IL-6 and dual conditions (‘unassisted sites’) and the fraction of sites where a significant (fold change ≥1.7, p-value ≤0.01, measured with DESeq) increase in binding was found in dual-treated cells compared to IL-6-treated cells (‘assisted sites’). b, c Assisted STAT3 binding sites only reach maximal binding in the dual treatment whereas STAT3 binding at unassisted sites is higher in IL-6-treated cells. d The number of assisted STAT3 binding sites nearest to either synergistic genes or to the same number of dual-induced genes with an additive fold change. Plotted as a function of distance from gene transcriptional start site (TSS, plotted in 2.5 kb bins). Only the nearest site is counted, second- or third-nearest sites are not shown. e H3K27ac ChIP-seq tag density in the vicinity of STAT3 binding sites in the non-treated vs IL-1β conditions showing that IL-1β activates enhancers where assisted sites reside. f Nascent RNA levels of Saa1/2 in primary hepatocytes pre-treated with p300/CBP inhibitors followed by indicated cytokine treatments. Representative experiment shown of at least three independent repeats. Error bars represent s.d. of three technical replicates. g Box plot depicting the STAT3 motif score in assisted vs unassisted sites. Double asterisks denote p-value ≤0.01 as determined by an unpaired, two-tailed t-test

