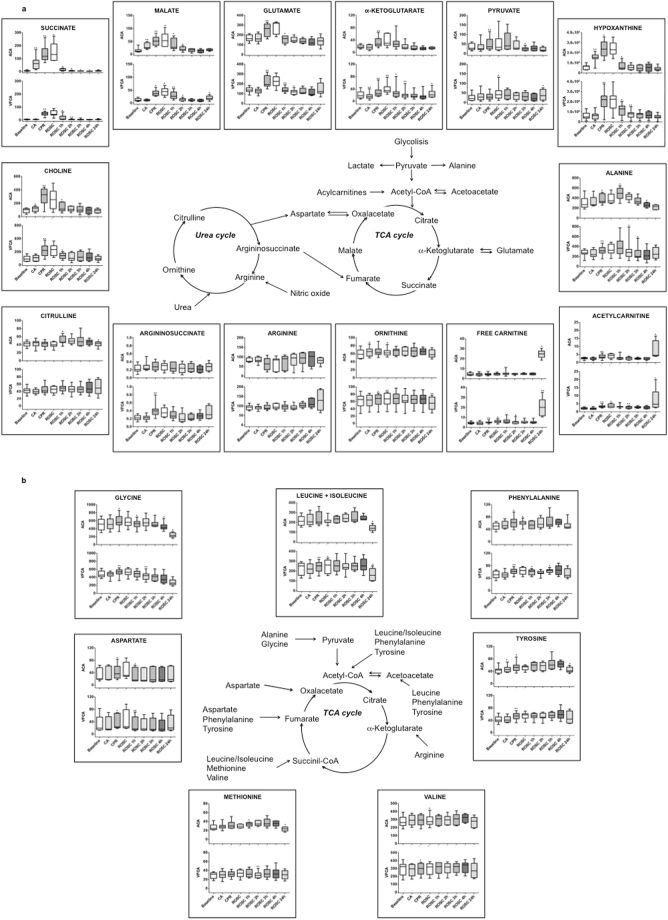
Figure 2.
Overview of LC-MS/MS quantification of key metabolite changes in plasma samples of animals undergoing asphyxial and dysrhythmic CA. Results, expressed in µmol/L, are graphed as box plots, indicating median values and upper and lower quartile distributions, at baseline, CA (last minute), CPR (last minute), ROSC and post-ROSC (1, 2, 3, 4, 24 h). (a) TCA cycle, urea cycle, lipid metabolism intermediates. (b) Anaplerotic replenishing of TCA cycle. Asterisks indicate statistical significance regarding the within group comparison of each phase with the previous one calculated by paired Wilcoxon t-test (*p-value ≤ 0.05, **p-value ≤ 0.01, ***p-value ≤ 0.001).

