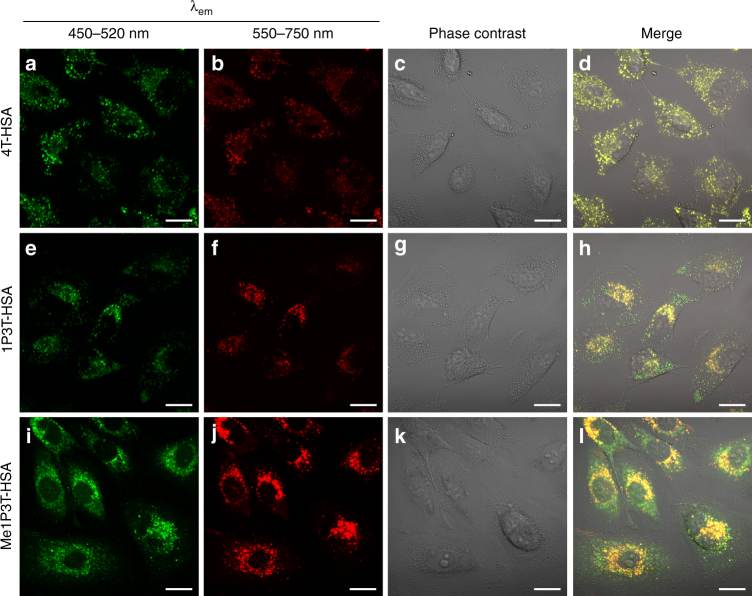
Fig. 6.
Internalization, distribution and assembly of the oligothiophenes in living cells. Confocal laser scanning micrographs of A549 cells treated with oligothiophene-albumin complex 4T-HSA a–d, 1P3T-HSA e–h, and Me1P3T-HSA i–l at 15 µM for 24 h (37 °C, 5% CO2). Molecular states (450–520 nm, green) and aggregates (550–750 nm, red) are visualized simultaneously (co-localization in yellow). Scale bar = 20 µm. All three compounds were internalized efficiently and show distinct localized fluorescence signals, which vary with the different head groups

