
Fig. 7.
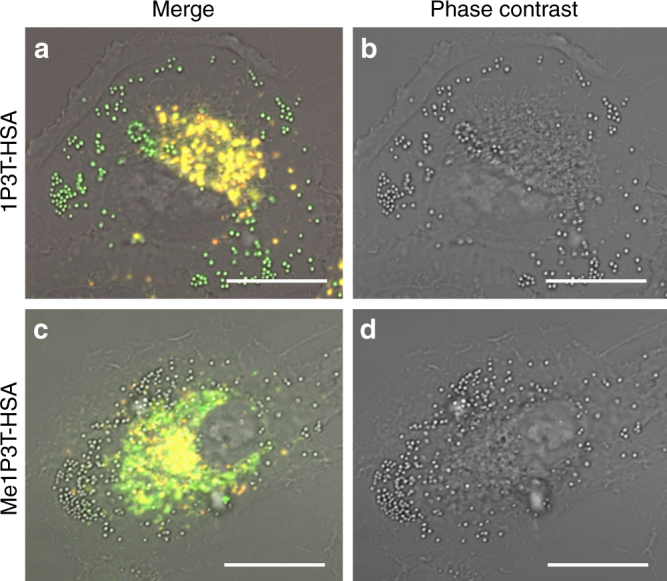
Fluorescence distribution/localization of the molecular and aggregated oligothiophenes. Confocal laser scanning micrographs of A549 cells treated with 1P3T-HSA a, b and Me1P3T-HSA c, d for 24 h at 37 °C, 5% CO2. Scale bar = 20 µm. The image was magnified to showcase defined features (1P3T: green vesicles; Me1P3T: non-emitting vesicles), fluorescence distribution, as well as the perinuclear localization of the aggregated states (yellow)