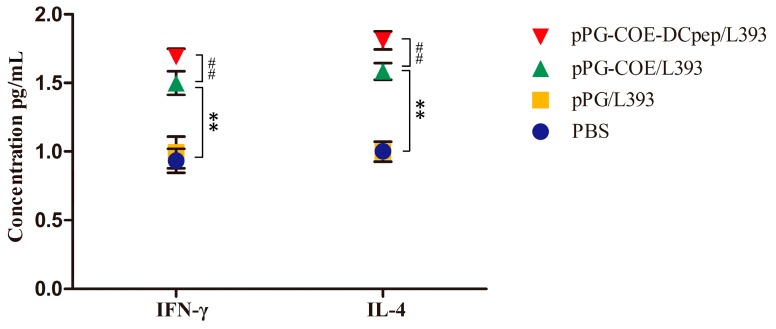
Figure 7.
Determination of cytokines produced by splenocytes of mice orally administered with pPG-COE-DCpep/L393, pPG-COE/L393, pPG/L393, and PBS, respectively. Bars represent the mean ± standard error value of each group (* p < 0.05, p < 0.01 compared to the control groups pPG/L393 and PBS; # p < 0.05, p < 0.01 compared to group pPG-COE/L393).

